C/1914 F1 Kritzinger
more info
Comet C/1914 F1 was discovered on 30 March 1914 by Hans Hermann Kritzinger (Bothkamp, Germany), Kronk raported about a prediscovery position taken on 24 March. At the moment of discovery C/1914 F1 was about two months before its perihelion passage, and it was last seen on 14 December 1914. [Kronk, Cometography: Volume 3].
This comet made its closest approach to the Earth on 9 May 1914 (0.495 au), that is almost six weeks after its discovery and almost four weeks before perihelion.
Solutions given here are based on data spanning over 0.707 yr in a range of heliocentric distances from 1.57 au through perihelion (1.20 au) to 2.94 au.
Pure gravitational orbit determined from all available positional measurements (285 observations) give 2a-class orbit, orbit given in Minor Planet Center is 2A class (62 obs. used, almost three months shorter arc of data; see MPC).
It was possible to determine the non-gravitational orbit for C/1914 F1 (preffered orbit), the RMS for NG orbit decreases (from 3.33 arcsec to 3.12 arcs) and some trends in O-C disappears (see figure). According to this model original semimajor axis of C/2014 F1 is about 1670 au.
This comet suffers significant planetary perturbations during its passage through the planetary system that lead to a more tight future orbit with semimajor axis of about 700 au (see future barycentric orbits given here for both solutions: pure gravitational and non-gravitational).
More details in Królikowska et al. 2014.
| solution description | ||
|---|---|---|
| number of observations | 285 | |
| data interval | 1914 03 30 – 1914 12 14 | |
| data type | perihelion within the observation arc (FULL) | |
| data arc selection | entire data set (STD) | |
| range of heliocentric distances | 1.57 au – 1.20 au (perihelion) – 2.94 au | |
| type of model of motion | NS - non-gravitational orbits for standard g(r) | |
| data weighting | YES | |
| number of residuals | 519 | |
| RMS [arcseconds] | 3.12 | |
| orbit quality class | 2a | |
| previous orbit statistics, both Galactic and stellar perturbations were taken into account | ||
|---|---|---|
| no. of returning VCs in the swarm | 5000 | * |
| no. of escaping VCs in the swarm | 1 | |
| no. of hyperbolas among escaping VCs in the swarm | 1 | |
| previous reciprocal semi-major axis [10-6 au-1] | 405.86 – 601.38 – 793.33 | R |
| previous perihelion distance [au] | 1.19952 – 1.19986 – 1.19989 | R |
| previous aphelion distance [103 au] | 2.5 – 3.3 – 4.9 | R |
| time interval to previous perihelion [Myr] | 0.045 – 0.068 – 0.12 | R |
| percentage of VCs with qprev < 10 | 100 | |
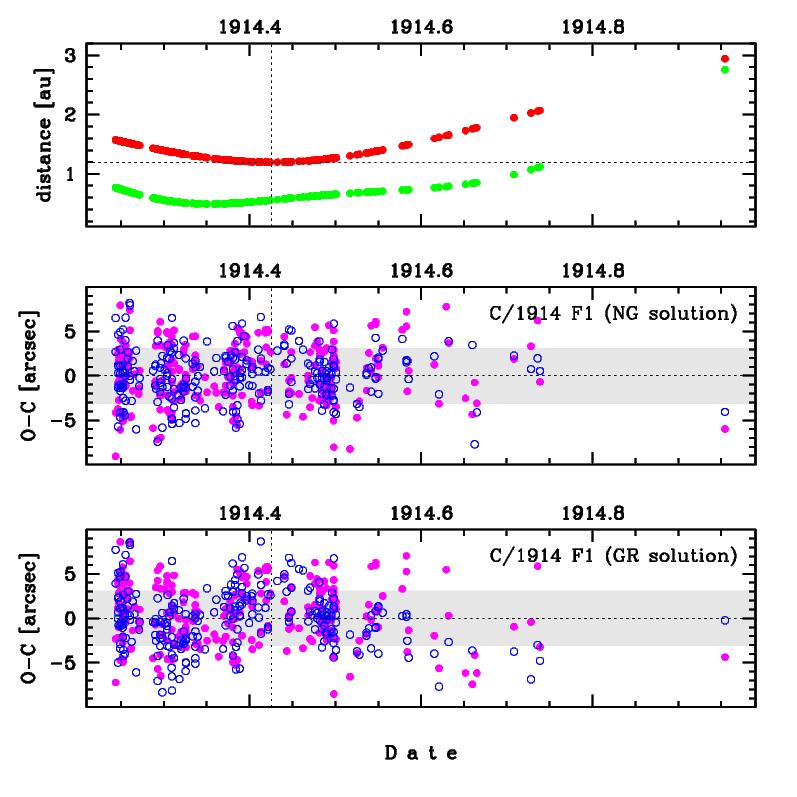
Upper panel: Time distribution of positional observations with corresponding heliocentric (red curve) and geocentric (green curve) distance at which they were taken. The horizontal dotted line shows the perihelion distance for a given comet whereas vertical dotted line — the moment of perihelion passage.
Lower panel (panels): O-C diagram for this(two) solution (solutions) given in this database, where residuals in right ascension are shown using magenta dots and in declination by blue open circles.
Lower panel (panels): O-C diagram for this(two) solution (solutions) given in this database, where residuals in right ascension are shown using magenta dots and in declination by blue open circles.
| previous_g orbit statistics, here only the Galactic tide has been included | ||
|---|---|---|
| no. of returning VCs in the swarm | 5000 | * |
| no. of escaping VCs in the swarm | 1 | |
| no. of hyperbolas among escaping VCs in the swarm | 1 | |
| previous reciprocal semi-major axis [10-6 au-1] | 405.86 – 601.38 – 793.33 | R |
| previous perihelion distance [au] | 1.19973 – 1.19983 – 1.19985 | R |
| previous aphelion distance [103 au] | 2.5 – 3.3 – 4.9 | R |
| time interval to previous perihelion [Myr] | 0.045 – 0.068 – 0.12 | R |
| percentage of VCs with qprev < 10 | 100 | |