C/1916 G1 Wolf
more info
Comet C/1916 G1 was discovered on 4 April 1916 by Max F.J.C. Wolf (Königstuhl Observatory, Heidelberg, Germany), that is about 14.5 months before its perihelion passage, and the comet was last seen on 29 January 1918 [Kronk, Cometography: Volume 3].
This comet made its closest approach to the Earth on 21 August 1917 (0.988 au), that is about two months after its perihelion passage.
Solutions given here are based on data spanning over 1.81 yr in a range of heliocentric distances from 5.16 au through perihelion (1.69 au) to 3.25 au.
Pure gravitational orbit determined from all available positional measurements (469 observations) give 1a-class orbit, orbit given in Minor Planet Center is 2A class (186 obs. used, almost the same arc of data; see MPC).
It was possible to determine the non-gravitational orbit for C/1916 G1 (preffered orbit), the RMS for NG orbit decreases from 1.97 arcsec (pure gravitational orbit) to 1.84 arcs.
This Oort spike comet suffers moderate planetary perturbations during its passage through the planetary system that lead to a more tight future orbit with semimajor axis of about 1300 au (see future barycentric orbits given here for both solutions: pure gravitational and non-gravitational).
More details in Królikowska et al. 2014.
| solution description | ||
|---|---|---|
| number of observations | 471 | |
| data interval | 1916 04 07 – 1918 01 29 | |
| data type | perihelion within the observation arc (FULL) | |
| data arc selection | entire data set (STD) | |
| range of heliocentric distances | 5.16 au – 1.69 au (perihelion) – 5.74 au | |
| type of model of motion | NS - non-gravitational orbits for standard g(r) | |
| data weighting | YES | |
| number of residuals | 817 | |
| RMS [arcseconds] | 1.84 | |
| orbit quality class | 1b | |
| orbital elements (barycentric ecliptic J2000) | ||
|---|---|---|
| Epoch | 1617 04 14 | |
| perihelion date | 1917 06 17.36235273 | ± 0.00110334 |
| perihelion distance [au] | 1.69214922 | ± 0.00000924 |
| eccentricity | 0.99988224 | ± 0.00001603 |
| argument of perihelion [°] | 120.505372 | ± 0.000640 |
| ascending node [°] | 184.485407 | ± 0.000122 |
| inclination [°] | 25.605536 | ± 0.000064 |
| reciprocal semi-major axis [10-6 au-1] | 69.59 | ± 9.48 |
| file containing 5001 VCs swarm |
|---|
| 1916g1n5.bmi |
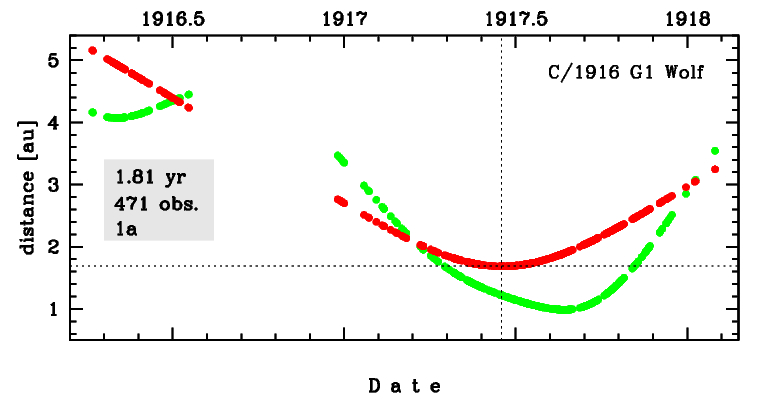
Time distribution of positional observations with corresponding heliocentric (red curve) and geocentric (green curve) distance at which they were taken. The horizontal dotted line shows the perihelion distance for a given comet whereas vertical dotted line — the moment of perihelion passage.
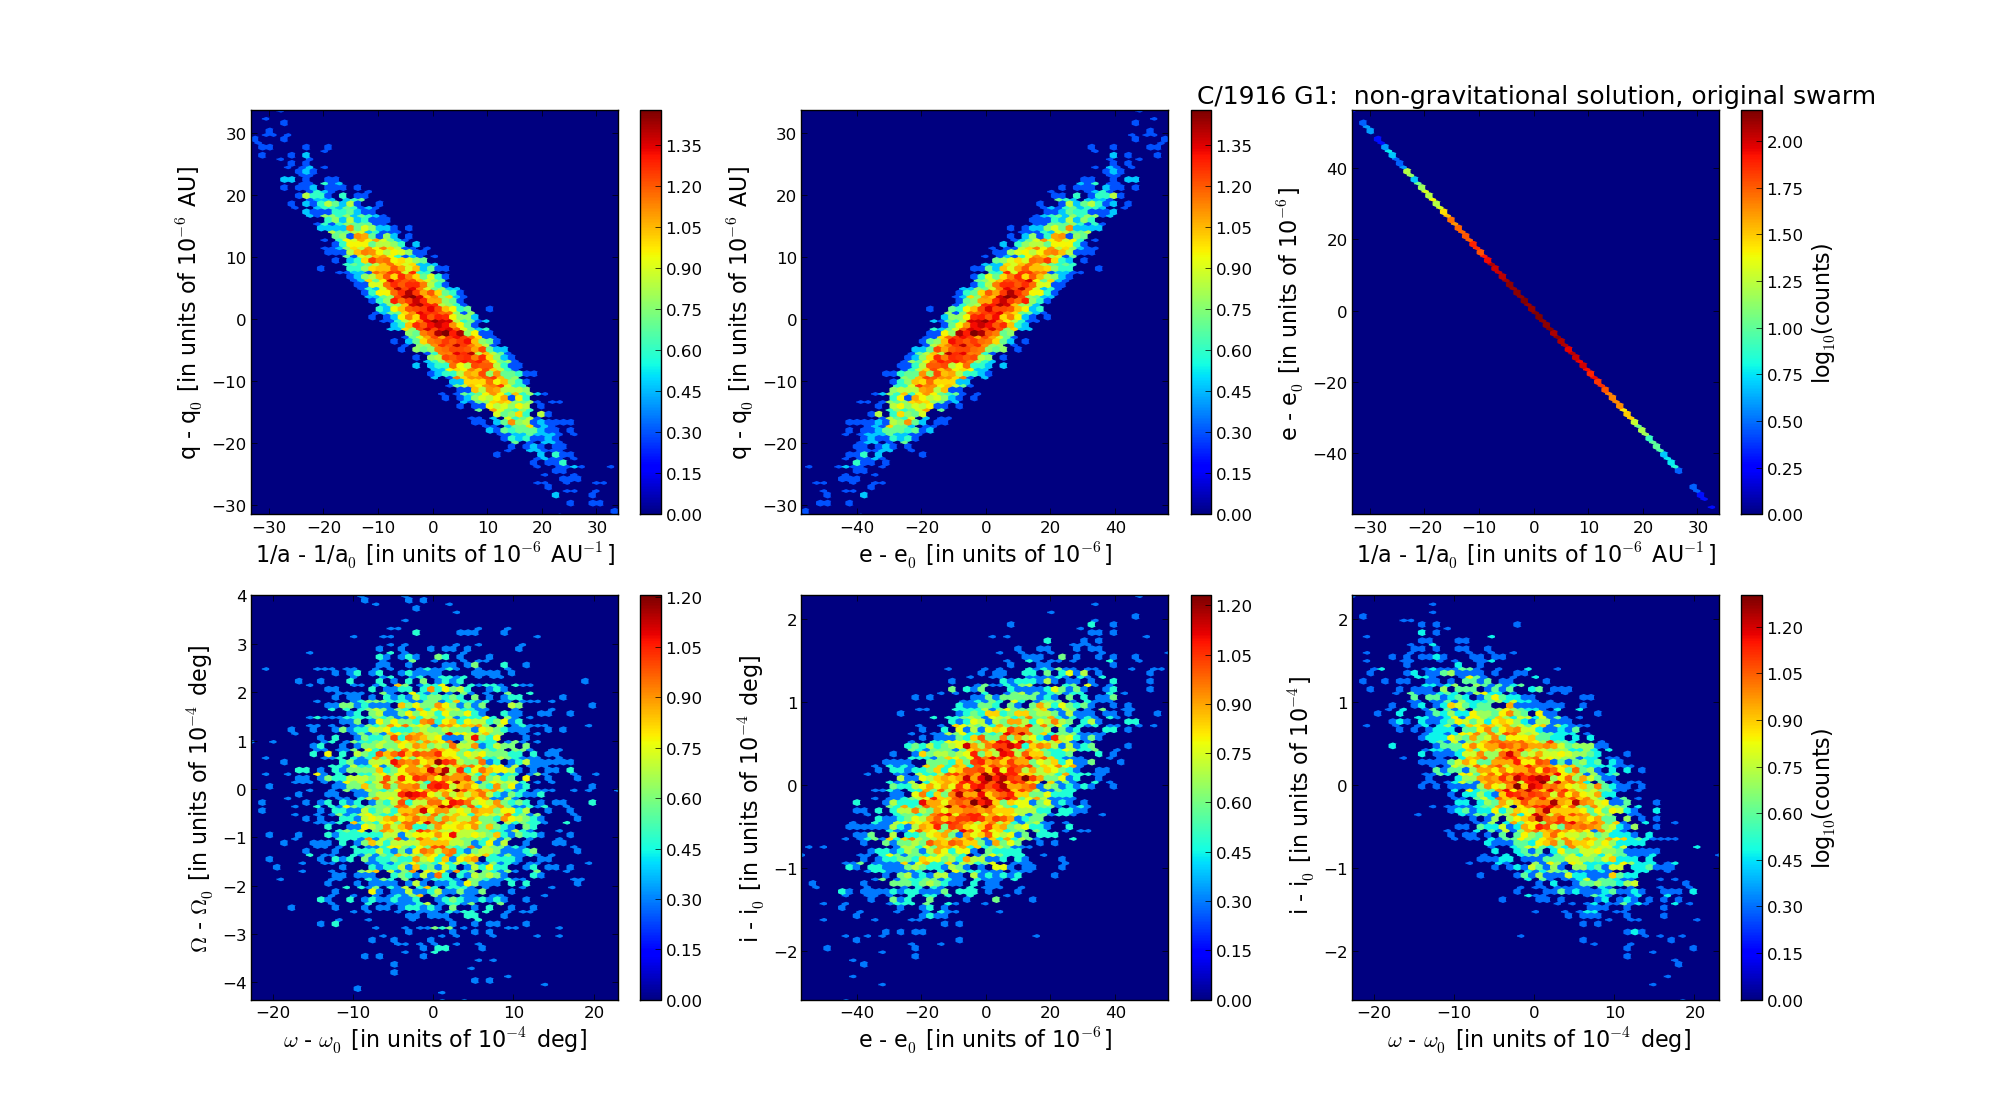
Six 2D-projections of the 6D space of original swarm including 5001 VCs. Each density map is given in logarithmic scale presented on the right in the individual panel.