C/1932 M2 Geddes
more info
Comet C/1932 M2 was discovered on 22 June 1932 by Murray Geddes (Otekura, New Zealand), that is one month before perihelion passage, and the comet was last seen on 19 July 1934 [Kronk, Cometography: Volume 3].About a year after its discovery, the prediscovery images on plates exposed on 14 August 1931 (at Bloemfontein, Harvard University Station in South Africa) were found.
This comet made its closest approach to the Earth on 1 July 1932 (1.97 au), that is nine days after its discovery.
Solution given here is based on data spanning over 2.93 yr in a range of heliocentric distances from 4.78 au through perihelion (2.31 au) to 6.83 au.
This Oort spike comet suffers small planetary perturbations during its passage through the planetary system; however, they led to escape the comet from the planetary zone on a hyperbolic orbit (see future barycentric orbit).
C/1932 M2 was in the original sample of 19 comets used by Oort for his hypothesis on LPCs; however, according to presented here statistics for previous perihelion passage its dynamical status is uncertain.
More details in Królikowska et al. 2014.
| solution description | ||
|---|---|---|
| number of observations | 328 | |
| data interval | 1931 08 14 – 1934 07 19 | |
| data type | perihelion within the observation arc (FULL) | |
| data arc selection | entire data set (STD) | |
| range of heliocentric distances | 4.78 au – 2.31 au (perihelion) – 6.83 au | |
| detectability of NG effects in the comet's motion | NG effects not determinable | |
| type of model of motion | GR - gravitational orbit | |
| data weighting | YES | |
| number of residuals | 546 | |
| RMS [arcseconds] | 1.77 | |
| orbit quality class | 1a | |
| next orbit statistics, both Galactic and stellar perturbations were taken into account | ||
|---|---|---|
| no. of returning VCs in the swarm | 0 | |
| no. of escaping VCs in the swarm | 5001 | |
| no. of hyperbolas among escaping VCs in the swarm | 5001 | * |
| next reciprocal semi-major axis [10-6 au-1] | -232.92 – -228.84 – -225.02 | |
| next perihelion distance [au] | 1.062 – 1.066 – 1.07 | |
| synchronous stop epoch [Myr] | 1.11 | S |
| percentage of VCs with qnext < 10 | 100 | |
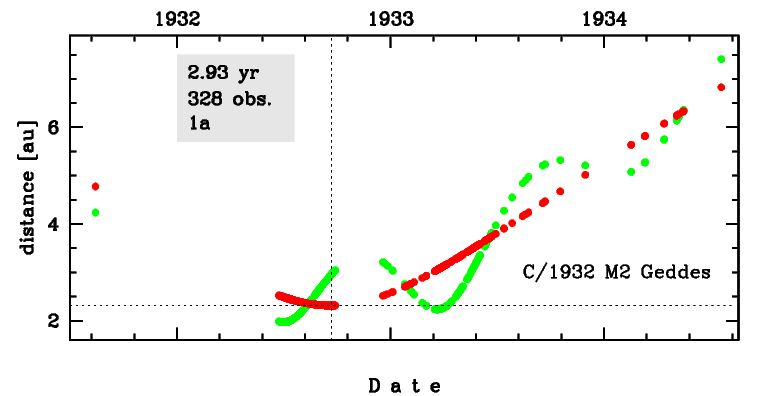
Time distribution of positional observations with corresponding heliocentric (red curve) and geocentric (green curve) distance at which they were taken. The horizontal dotted line shows the perihelion distance for a given comet whereas vertical dotted line — the moment of perihelion passage.
| next_g orbit statistics, here only the Galactic tide has been included | ||
|---|---|---|
| no. of returning VCs in the swarm | 0 | |
| no. of escaping VCs in the swarm | 5001 | |
| no. of hyperbolas among escaping VCs in the swarm | 5001 | * |
| next reciprocal semi-major axis [10-6 au-1] | -233.04 – -228.96 – -225.14 | |
| next perihelion distance [au] | 0.9216 – 0.9248 – 0.9281 | |
| synchronous stop epoch [Myr] | 1.12 | S |
| percentage of VCs with qnext < 10 | 100 | |