C/1937 N1 Finsler
more info
Comet C/1937 N1 was discovered on 4 July 1937 by Paul Finsler (Zürich, Switzerland), that is about 1.5 months before its perihelion passage, and the comet was last seen on 30 December 1937 [Kronk, Cometography: Volume 4].
This comet made its closest approach to the Earth on 9 August 1937 (0.548 au), that is 6 days before perihelion passage.
Solutions given here are based on data spanning over 0.490 yr in a range of heliocentric distances from 1.144 au through perihelion (0.863 au) to 2.355 au.
Pure gravitational orbit determined from all available positional measurements (417 observations) give 2a-class orbit similarly as in Minor Planet Center (212 obs. used, the same arc of data; 2A-class, see MPC).
It was possible to determine the non-gravitational orbit for C/1937 N1 (preferred orbit); the derived NG solution give significantly different original and future 1/a as in the case of pure gravitational model of motion.
This comet suffers rather small planetary perturbations during its passage through the planetary system. However, the change of 1/a due to these perturbations turned out to be quite different in both models of motion (see original and future barycentric orbits in both solutions).
More details in Królikowska et al. 2014.
| solution description | ||
|---|---|---|
| number of observations | 413 | |
| data interval | 1937 07 04 – 1937 12 30 | |
| data type | perihelion within the observation arc (FULL) | |
| data arc selection | entire data set (STD) | |
| range of heliocentric distances | 1.14 au – 0.86 au (perihelion) – 2.36 au | |
| type of model of motion | NS - non-gravitational orbits for standard g(r) | |
| data weighting | YES | |
| number of residuals | 766 | |
| RMS [arcseconds] | 1.92 | |
| orbit quality class | 2b | |
| next orbit statistics, both Galactic and stellar perturbations were taken into account | ||
|---|---|---|
| no. of returning VCs in the swarm | 4454 | * |
| no. of escaping VCs in the swarm | 547 | |
| no. of hyperbolas among escaping VCs in the swarm | 476 | |
| next reciprocal semi-major axis [10-6 au-1] | 82.48 – 252.92 – 454.48 | R |
| next perihelion distance [au] | 0.857 – 0.858 – 0.9614 | R |
| next aphelion distance [103 au] | 4.4 – 7.9 – 24 | R |
| time interval to next perihelion [Myr] | 0.1 – 0.25 – 1.4 | R |
| percentage of VCs with qnext < 10 | 91 | |
| percentage of VCs with qnext > 20 | 9 | |
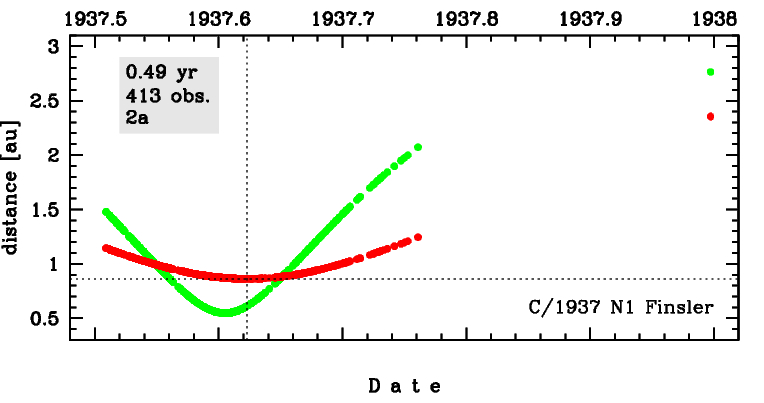
Time distribution of positional observations with corresponding heliocentric (red curve) and geocentric (green curve) distance at which they were taken. The horizontal dotted line shows the perihelion distance for a given comet whereas vertical dotted line — the moment of perihelion passage.
| next_g orbit statistics, here only the Galactic tide has been included | ||
|---|---|---|
| no. of returning VCs in the swarm | 4447 | * |
| no. of escaping VCs in the swarm | 554 | |
| no. of hyperbolas among escaping VCs in the swarm | 476 | |
| next reciprocal semi-major axis [10-6 au-1] | 82.29 – 253.33 – 454.64 | R |
| next perihelion distance [au] | 0.8602 – 0.8622 – 0.9819 | R |
| next aphelion distance [103 au] | 4.4 – 7.9 – 24 | R |
| time interval to next perihelion [Myr] | 0.1 – 0.25 – 1.3 | R |
| percentage of VCs with qnext < 10 | 98 | |
| percentage of VCs with 10 < qnext < 20 | 1 | |
| percentage of VCs with qnext > 20 | 1 | |