C/1956 R1 Arend-Roland
more info
Comet C/1956 R1 was discovered on 8 November 1956 by Sylvain Julien Victor Arend and Georges Roland (Royal Observatory, Uccle, Belgium), that is 5 months before its perihelion passage. Later, Sigeru Kaho (Tokyo Observatory, Konko Station, Japan) found an image of this comet on a plate he had exposed on 7 November 1956 during observations of variable stars. C/1956 R1 was observed until 11 April 1958 [Kronk, Cometography: Volume 4].
Comet had its closest approach to the Earth on 20 April 1957 (0.569 au), 12 days after its perihelion passage.
This is a comet with nongravitational effects strongly manifested in positional data fitting. Two NG solutions given here are based on data spanning over 0.602 yr in a range of heliocentric distances: 1.16 au – 0.778 au (perihelion) – 2.86 au; asymmetric NG solution was chosen as preffered orbit.
All solutions given here are based on data spanning over 1.42 yr in a range of heliocentric distances: 2.83 au – 0.316 au (perihelion) – 5.36 au.
This Oort spike comet suffers rather notable planetary perturbations during its passage through the planetary system; these perturbations lead to escape the comet from the planetary zone on a hyperbolic orbit (see future barycentric orbits).
See also Królikowska 2014 and Królikowska 2020.
| solution description | ||
|---|---|---|
| number of observations | 239 | |
| data interval | 1956 11 08 – 1958 04 11 | |
| data type | perihelion within the observation arc (FULL) | |
| data arc selection | entire data set (STD) | |
| range of heliocentric distances | 2.83 au – 0.32 au (perihelion) – 5.36 au | |
| type of model of motion | NT - non-gravitational orbits for asymmetric, standard g(r) | |
| data weighting | YES | |
| number of residuals | 458 | |
| RMS [arcseconds] | 1.38 | |
| orbit quality class | 1b | |
| orbital elements (barycentric ecliptic J2000) | ||
|---|---|---|
| Epoch | 1659 06 13 | |
| perihelion date | 1957 04 08.52300555 | ± 0.00039656 |
| perihelion distance [au] | 0.31728936 | ± 0.00001198 |
| eccentricity | 0.99997589 | ± 0.00000840 |
| argument of perihelion [°] | 308.758733 | ± 0.001316 |
| ascending node [°] | 215.775260 | ± 0.000117 |
| inclination [°] | 119.986542 | ± 0.000138 |
| reciprocal semi-major axis [10-6 au-1] | 75.99 | ± 26.48 |
| file containing 5001 VCs swarm |
|---|
| 1956r1n3.bmi |
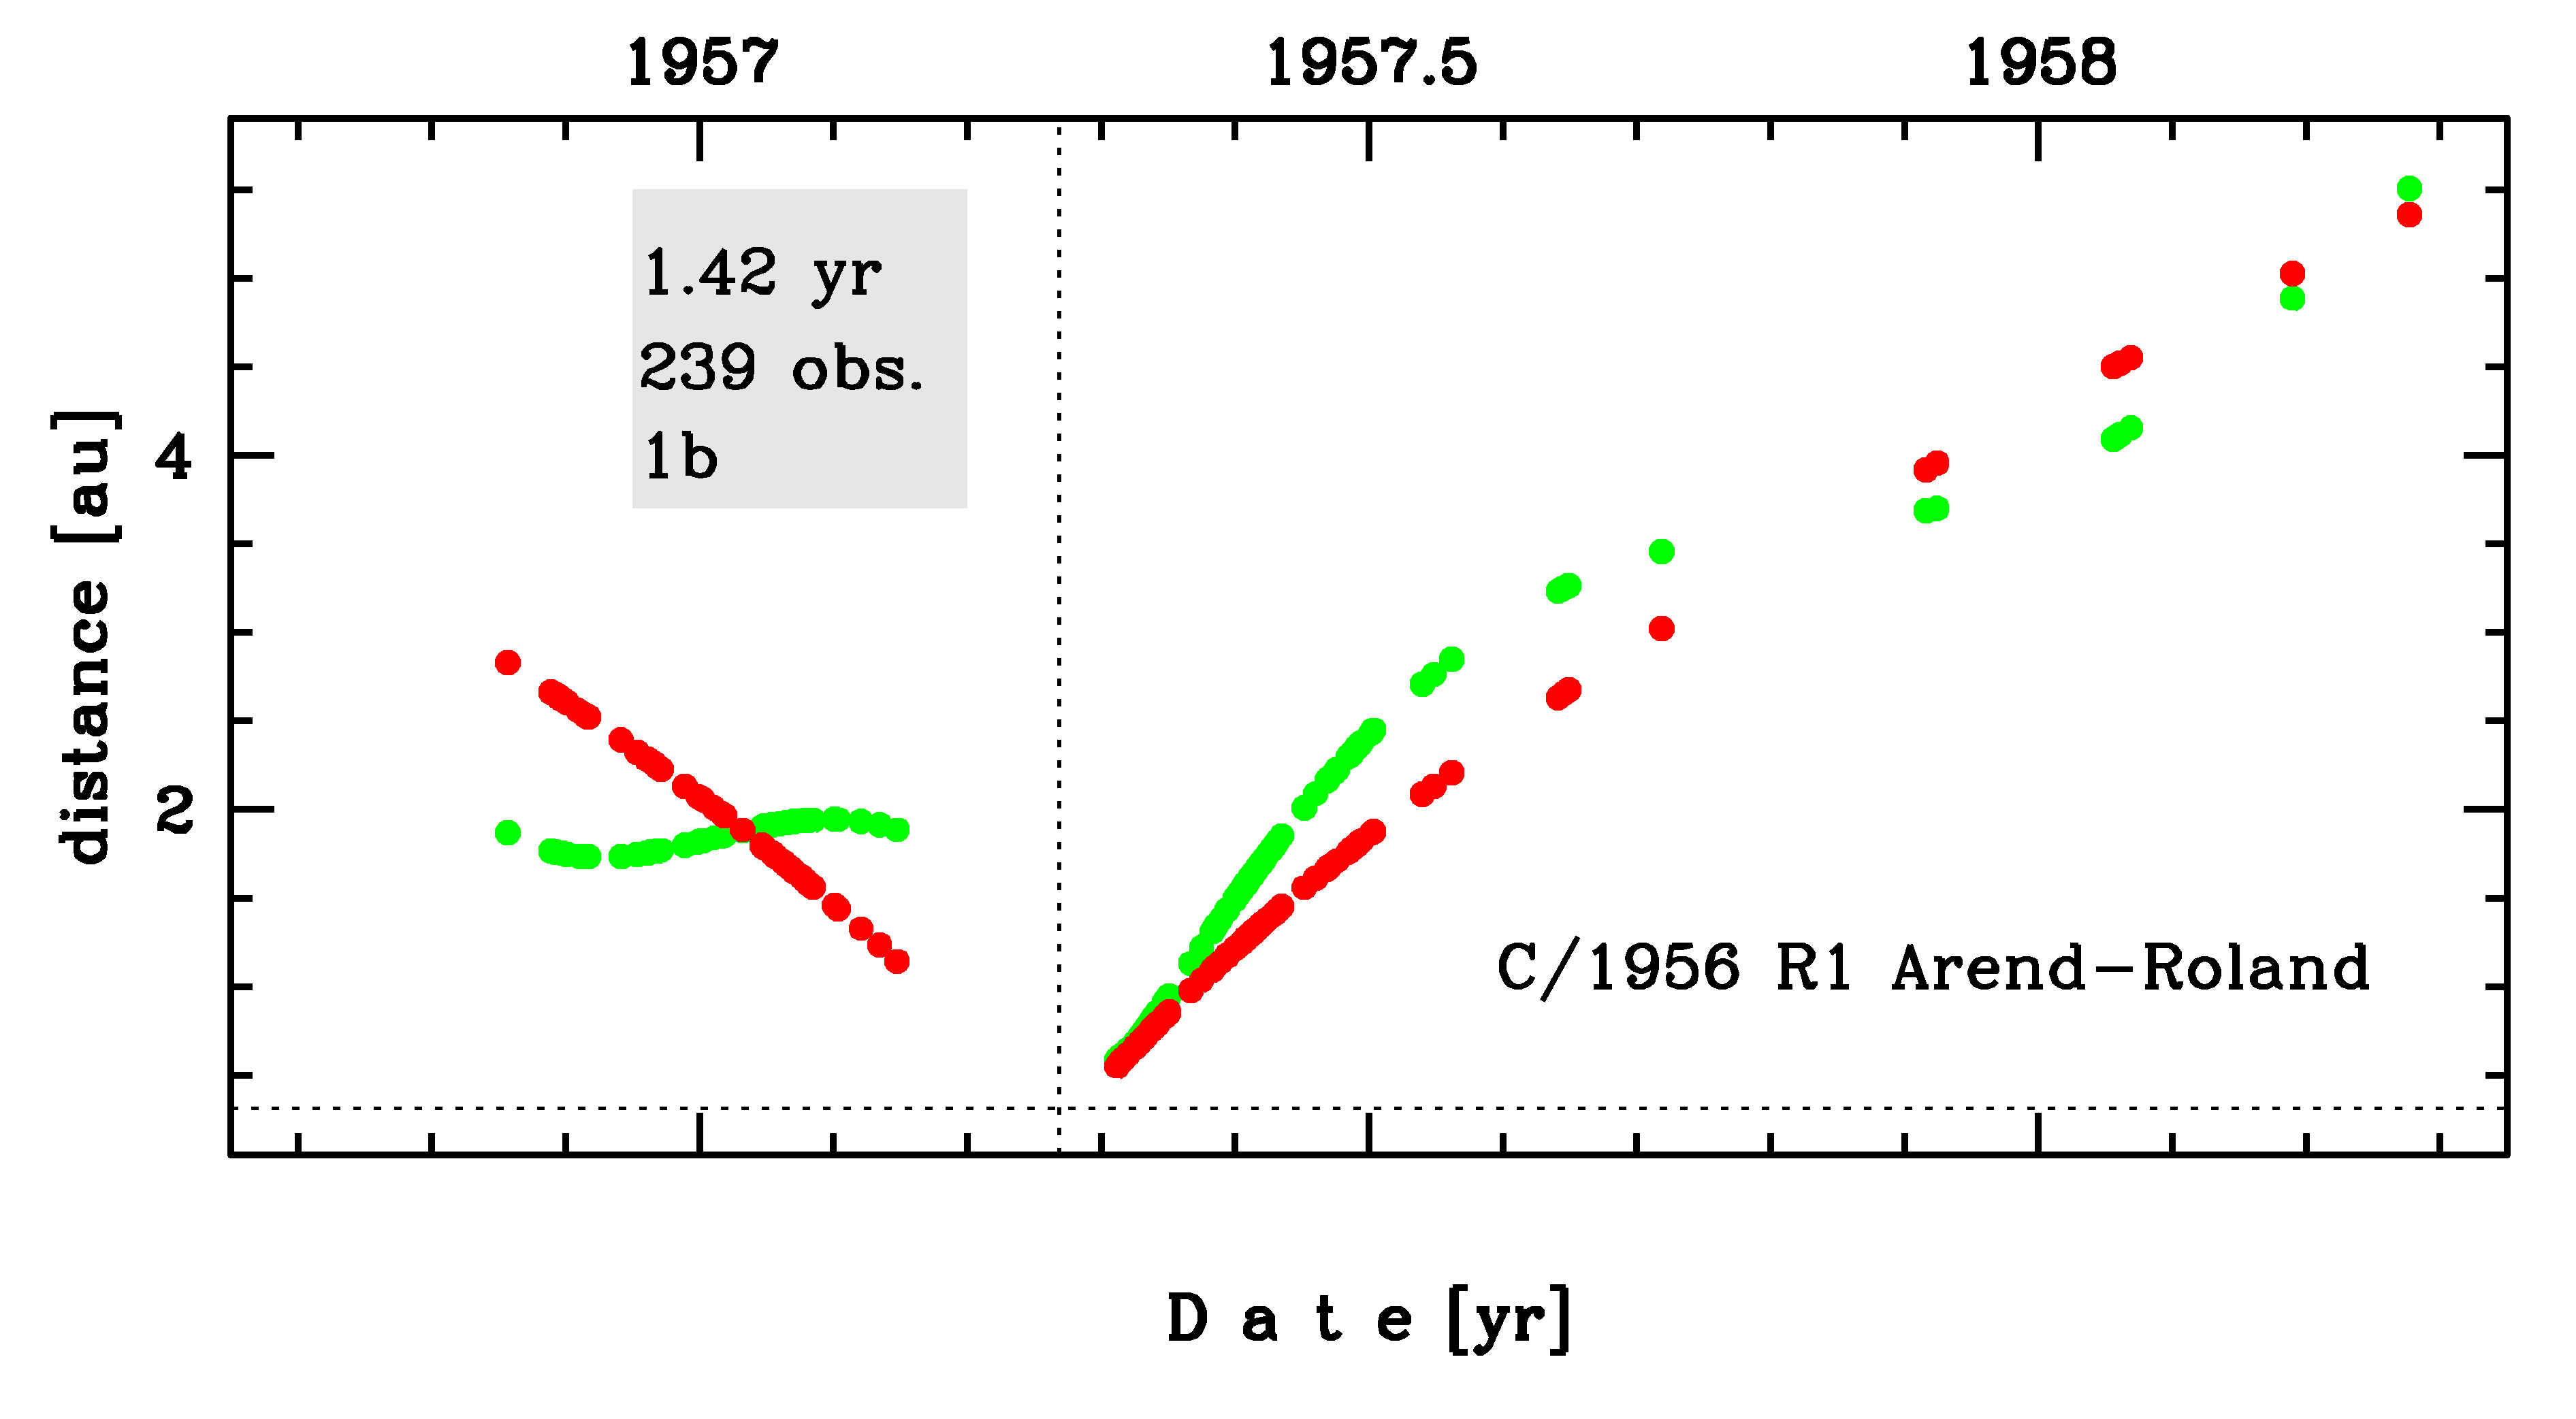
Time distribution of positional observations with corresponding heliocentric (red curve) and geocentric (green curve) distance at which they were taken. The horizontal dotted line shows the perihelion distance for a given comet whereas vertical dotted line — the moment of perihelion passage.
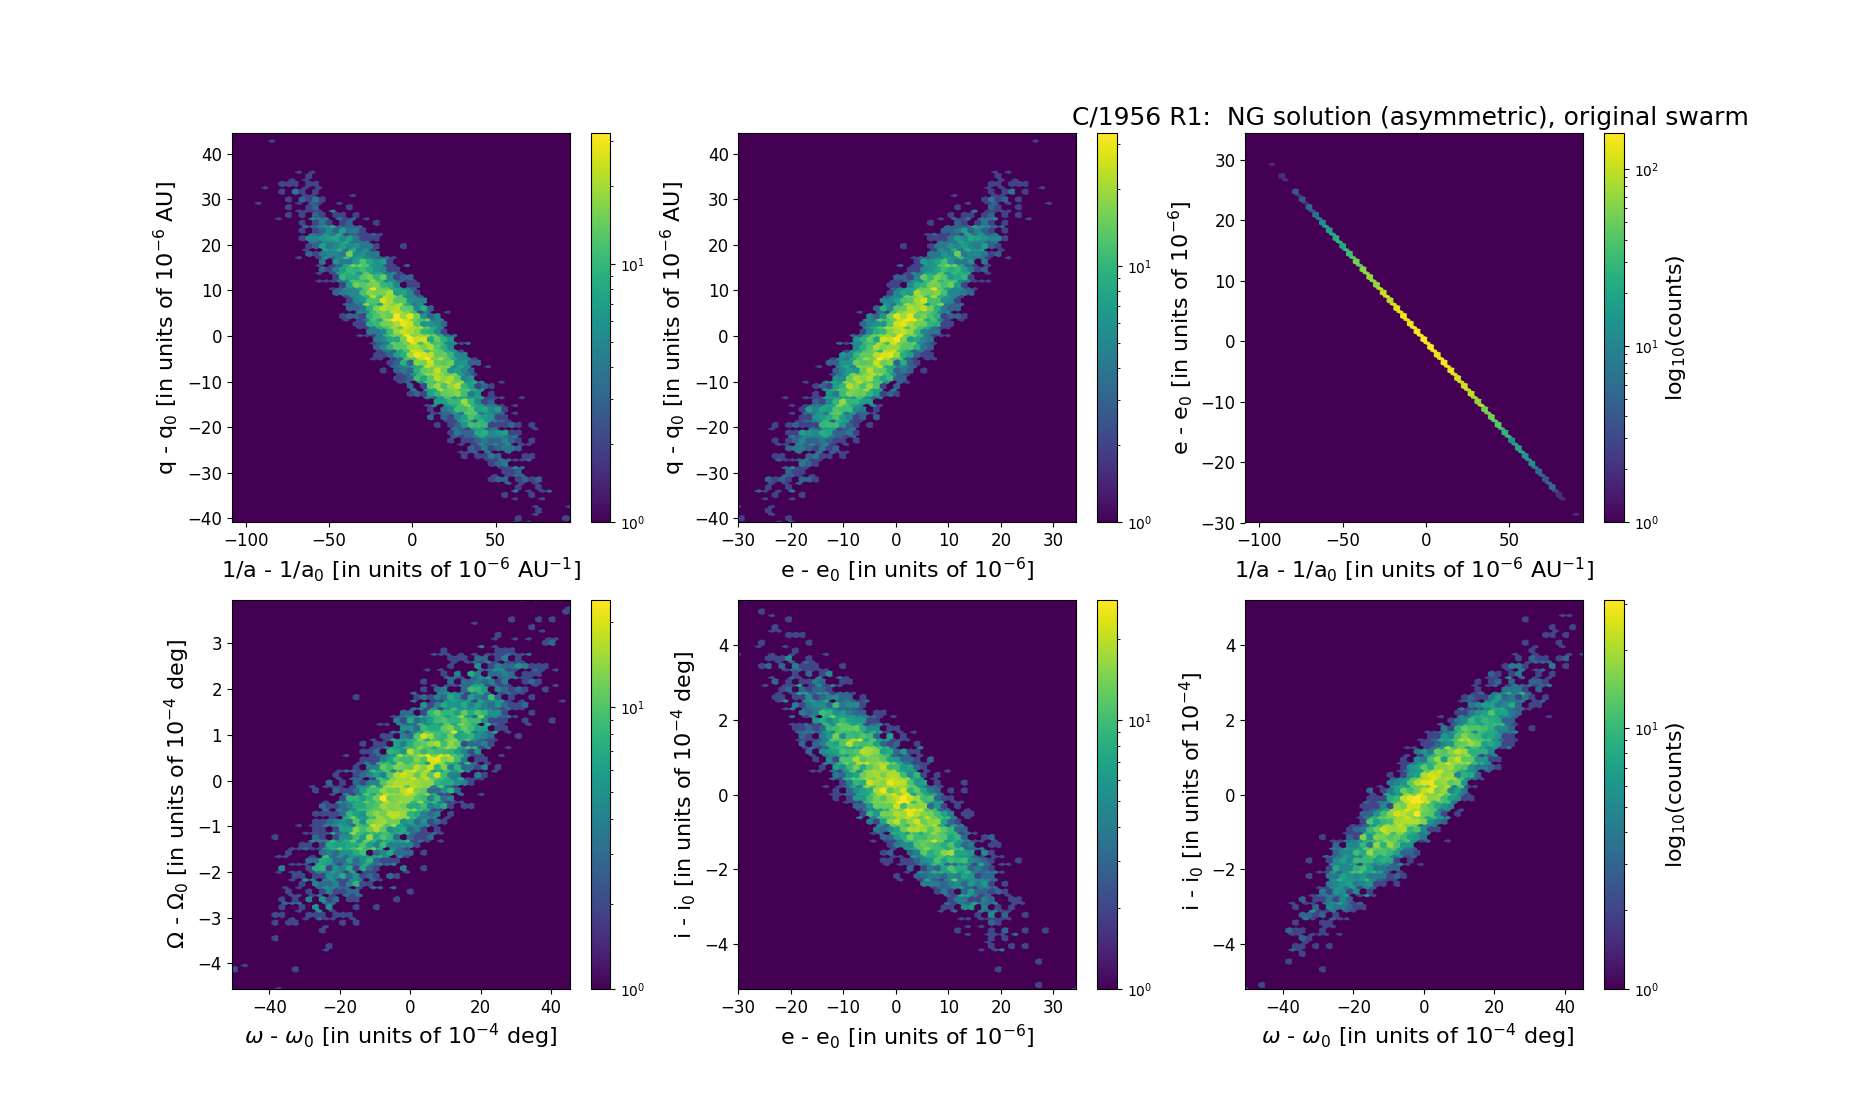
Six 2D-projections of the 6D space of original swarm including 5001 VCs. Each density map is given in logarithmic scale presented on the right in the individual panel.