C/1966 T1 Rudnicki
more info
Comet C/1966 R1 was discovered on 15 October 1966 by Polish astronomer Konrad Rudnicki in the course of the Palomar Supernova Search Program (USA), that is almost 3 months before its perihelion passage. It was observed until 28 February 1967.
Comet had its closest approach to the Earth on 26 December 1966 (0.412 au), more than two months after its discovery.
The first hyperbolic orbit was determined by Grzegorz Sitarski and Krzysztof Ziołkowski using 21 observations (IAU Circ., No. 1983, December 1966). Solution given here is based on data spanning over 0.312 yr in a range of heliocentric distances: 1.49 au – 0.419 au (perihelion) – 0.628 au.
This Oort spike comet suffers large planetary perturbations during its passage through the planetary system; these perturbations lead to escape the comet from the planetary zone on a hyperbolic orbit (see future barycentric orbits).
See also Królikowska 2020.
| solution description | ||
|---|---|---|
| number of observations | 50 | |
| data interval | 1966 10 17 – 1967 02 08 | |
| data type | significantly more measurements before perihelion (PRE+) | |
| data arc selection | entire data set (STD) | |
| range of heliocentric distances | 1.49 au – 0.42 au (perihelion) – 0.62 au | |
| detectability of NG effects in the comet's motion | NG effects not determinable | |
| type of model of motion | GR - gravitational orbit | |
| data weighting | NO | |
| number of residuals | 97 | |
| RMS [arcseconds] | 1.68 | |
| orbit quality class | 2a | |
| previous orbit statistics, both Galactic and stellar perturbations were taken into account | ||
|---|---|---|
| no. of returning VCs in the swarm | 4897 | * |
| no. of escaping VCs in the swarm | 104 | |
| no. of hyperbolas among escaping VCs in the swarm | 39 | |
| previous reciprocal semi-major axis [10-6 au-1] | 38.85 – 88.43 – 136.31 | R |
| previous perihelion distance [au] | 0.45 – 0.6 – 300 | R |
| previous aphelion distance [103 au] | 15 – 23 – 51 | R |
| time interval to previous perihelion [Myr] | 0.63 – 1.2 – 3.2 | R |
| percentage of VCs with qprev < 10 | 84 | |
| percentage of VCs with qprev > 20 | 16 | |
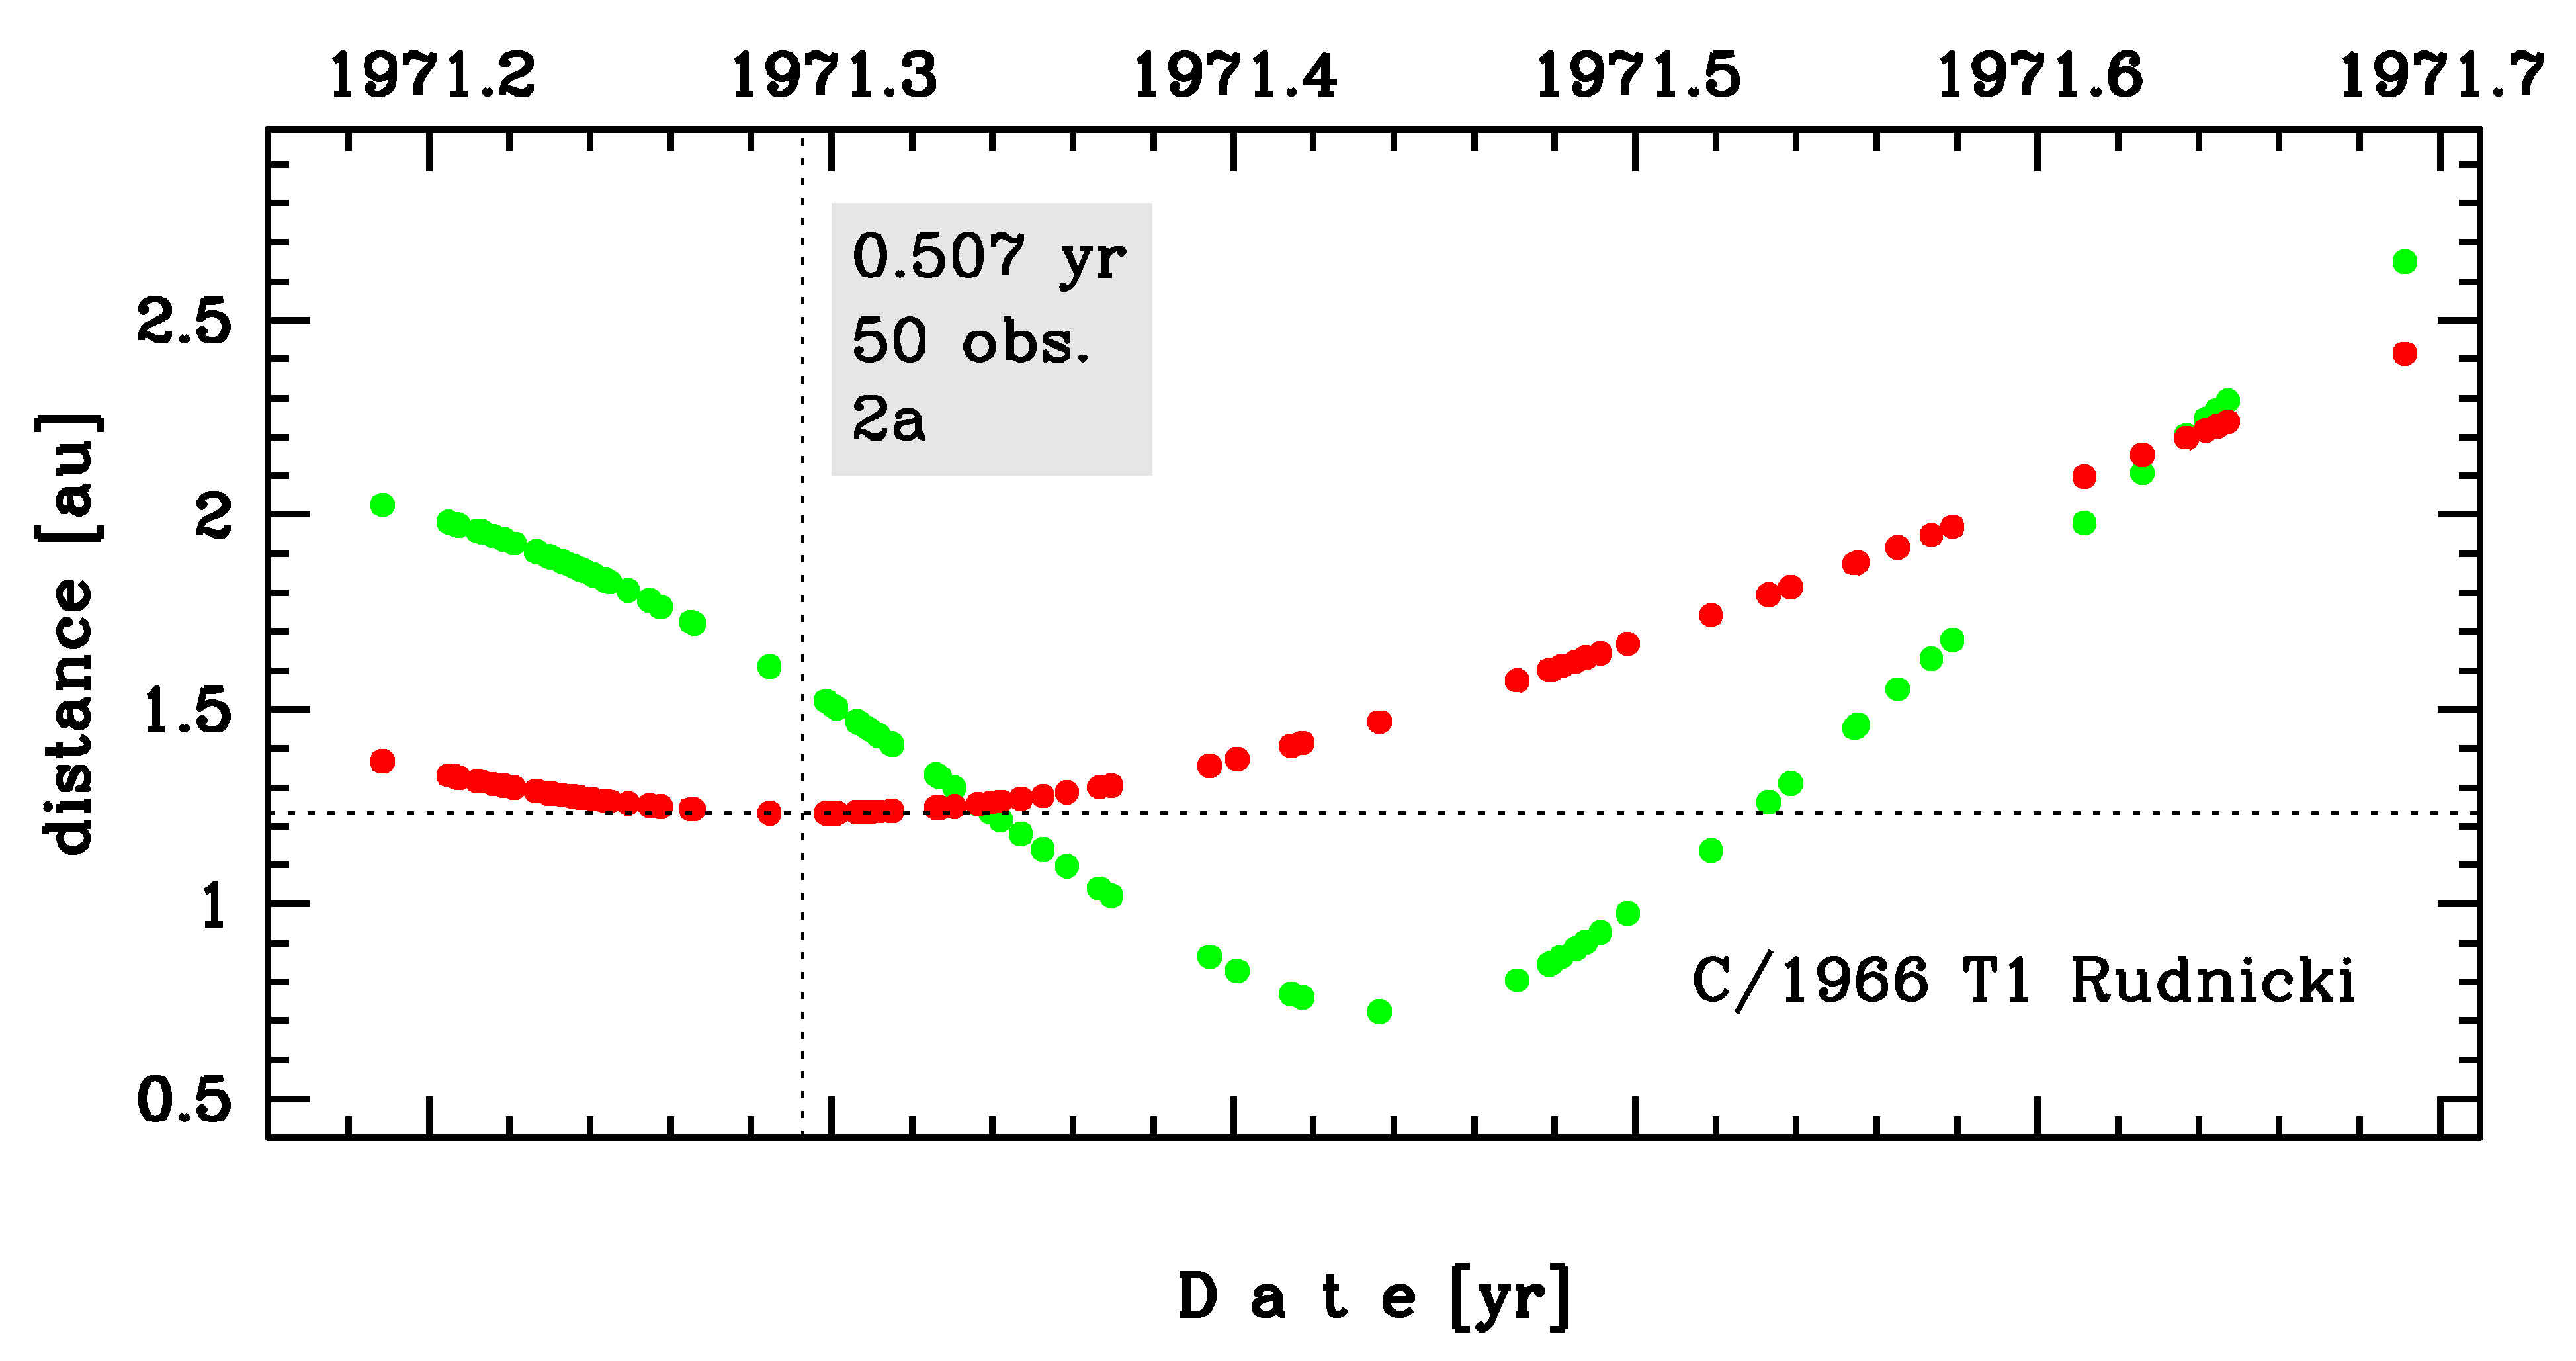
Time distribution of positional observations with corresponding heliocentric (red curve) and geocentric (green curve) distance at which they were taken. The horizontal dotted line shows the perihelion distance for a given comet whereas vertical dotted line — the moment of perihelion passage.
| previous_g orbit statistics, here only the Galactic tide has been included | ||
|---|---|---|
| no. of returning VCs in the swarm | 4876 | * |
| no. of escaping VCs in the swarm | 125 | |
| no. of hyperbolas among escaping VCs in the swarm | 40 | |
| previous reciprocal semi-major axis [10-6 au-1] | 46.30 – 88.73 – 136.51 | R |
| previous perihelion distance [au] | 0.44 – 0.55 – 2.8 | R |
| previous aphelion distance [103 au] | 15 – 23 – 43 | R |
| time interval to previous perihelion [Myr] | 0.63 – 1.2 – 3.1 | R |
| percentage of VCs with qprev < 10 | 95 | |
| percentage of VCs with 10 < qprev < 20 | 1 | |
| percentage of VCs with qprev > 20 | 4 | |