C/1971 E1 Toba
more info
Comet C/1971 E1 was discovered on 7 March 1971 by Kenji Toba (Tsuchiura, Ibaraki, Japan), that is more than a month before its perihelion passage. It was observed until 9 September 1971 [Kronk, Cometography: Volume 5].
Comet had its closest approach to the Earth on 9 June 1971 (0.724 au), about a month and 3 weeks after its perihelion passage.
Solutions given here are based on data spanning over 0.504 yr in a range of heliocentric distances: 1.37 au – 1.233 au (perihelion) – 2.41 au.
This comet suffers moderate planetary perturbations during its passage through the planetary system; according to preferred solution these perturbations lead to escape the comet from the planetary zone on a hyperbolic orbit (see future barycentric orbits).
See also Królikowska 2020.
| solution description | ||
|---|---|---|
| number of observations | 137 | |
| data interval | 1971 03 09 – 1971 09 09 | |
| data type | perihelion within the observation arc (FULL) | |
| data arc selection | entire data set (STD) | |
| range of heliocentric distances | 1.37 au – 1.23 au (perihelion) – 2.41 au | |
| detectability of NG effects in the comet's motion | comet with determinable NG~orbit | |
| type of model of motion | GR - gravitational orbit | |
| data weighting | YES | |
| number of residuals | 272 | |
| RMS [arcseconds] | 1.35 | |
| orbit quality class | 2a | |
| next orbit statistics, both Galactic and stellar perturbations were taken into account | ||
|---|---|---|
| no. of returning VCs in the swarm | 0 | |
| no. of escaping VCs in the swarm | 5001 | |
| no. of hyperbolas among escaping VCs in the swarm | 5001 | * |
| next reciprocal semi-major axis [10-6 au-1] | -669.63 – -592.41 – -516.92 | |
| next perihelion distance [au] | 1.74 – 1.81 – 1.88 | |
| synchronous stop epoch [Myr] | 0.64 | S |
| percentage of VCs with qnext < 10 | 100 | |
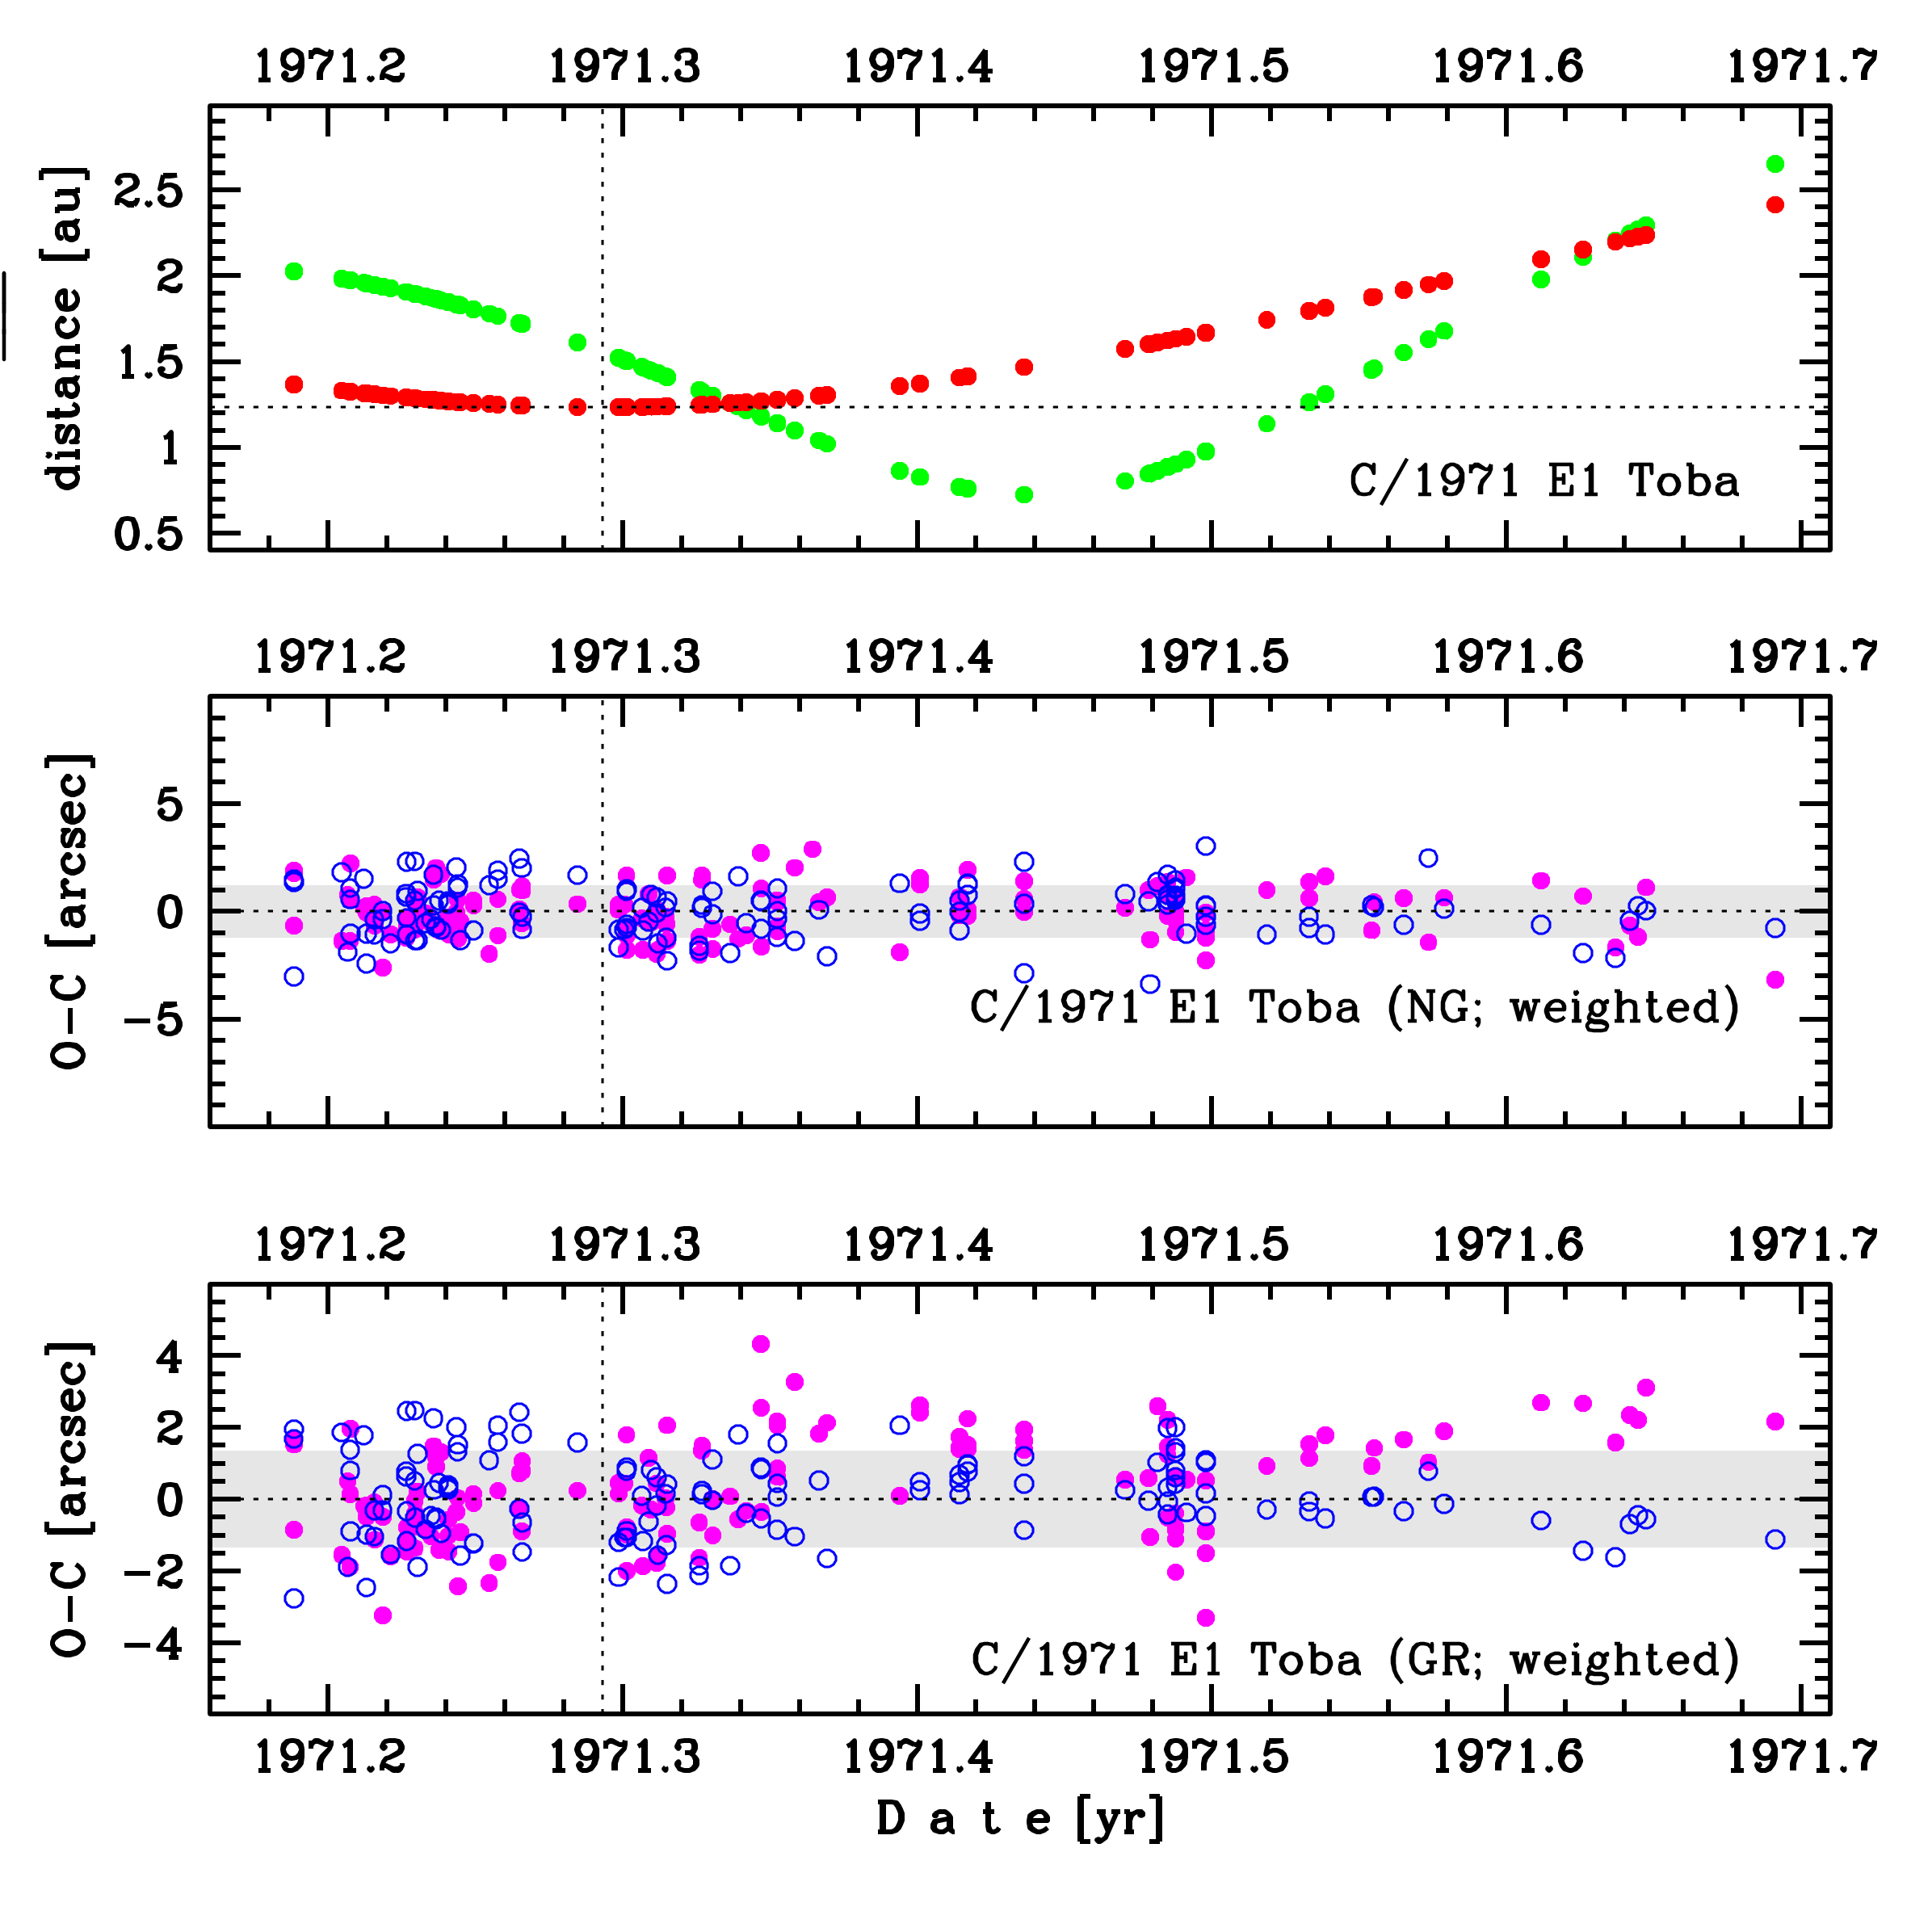
Upper panel: Time distribution of positional observations with corresponding heliocentric (red curve) and geocentric (green curve) distance at which they were taken. The horizontal dotted line shows the perihelion distance for a given comet whereas vertical dotted line — the moment of perihelion passage.
Lower panel (panels): O-C diagram for this(two) solution (solutions) given in this database, where residuals in right ascension are shown using magenta dots and in declination by blue open circles.
Lower panel (panels): O-C diagram for this(two) solution (solutions) given in this database, where residuals in right ascension are shown using magenta dots and in declination by blue open circles.
| next_g orbit statistics, here only the Galactic tide has been included | ||
|---|---|---|
| no. of returning VCs in the swarm | 0 | |
| no. of escaping VCs in the swarm | 5001 | |
| no. of hyperbolas among escaping VCs in the swarm | 5001 | * |
| next reciprocal semi-major axis [10-6 au-1] | -669.62 – -592.41 – -516.91 | |
| next perihelion distance [au] | 1.75 – 1.82 – 1.9 | |
| synchronous stop epoch [Myr] | 0.663 | S |
| percentage of VCs with qnext < 10 | 100 | |