C/1973 A1 Heck-Sause
more info
Comet C/1973 A1 was discovered on 11 January 1973 by André Heck and Gérard Sause (Haute Provence Observatory, France), that is more than 3 months after its perihelion passage.In the next few months prediscovery images were found taken on 4 January (Sendai Municipal Observatory, Japan) and 10 January (Montpellier, France). This comet was observed until 26 February 1974 [Kronk, Cometography: Volume 5].
Comet had its closest approach to the Earth on 11 February 1973 (1.978 au), a month after its discovery.
Solution given here is based on post-perihelion data spanning over 1.13 yr in a range of heliocentric distances from 2.70 au to 5.53 au.
This Oort spike comet suffers rather small planetary perturbations during its passage through the planetary system; these perturbations lead to a more tight future orbit.
See also Królikowska 2020.
| solution description | ||
|---|---|---|
| number of observations | 201 | |
| data interval | 1973 01 04 – 1974 02 19 | |
| data type | observed only after perihelion (POST) | |
| data arc selection | entire data set (STD) | |
| range of heliocentric distances | 2.7 au – 5.53au | |
| detectability of NG effects in the comet's motion | NG effects not determinable | |
| type of model of motion | GR - gravitational orbit | |
| data weighting | YES | |
| number of residuals | 400 | |
| RMS [arcseconds] | 1.24 | |
| orbit quality class | 1b | |
| orbital elements (barycentric ecliptic J2000) | ||
|---|---|---|
| Epoch | 1671 03 02 | |
| perihelion date | 1972 10 05.33953009 | ± 0.00227173 |
| perihelion distance [au] | 2.50898352 | ± 0.00001464 |
| eccentricity | 0.99983430 | ± 0.00003043 |
| argument of perihelion [°] | 346.199797 | ± 0.000833 |
| ascending node [°] | 175.803902 | ± 0.000144 |
| inclination [°] | 138.589327 | ± 0.00014 |
| reciprocal semi-major axis [10-6 au-1] | 66.04 | ± 12.13 |
| file containing 5001 VCs swarm |
|---|
| 1973a1a5.bmi |
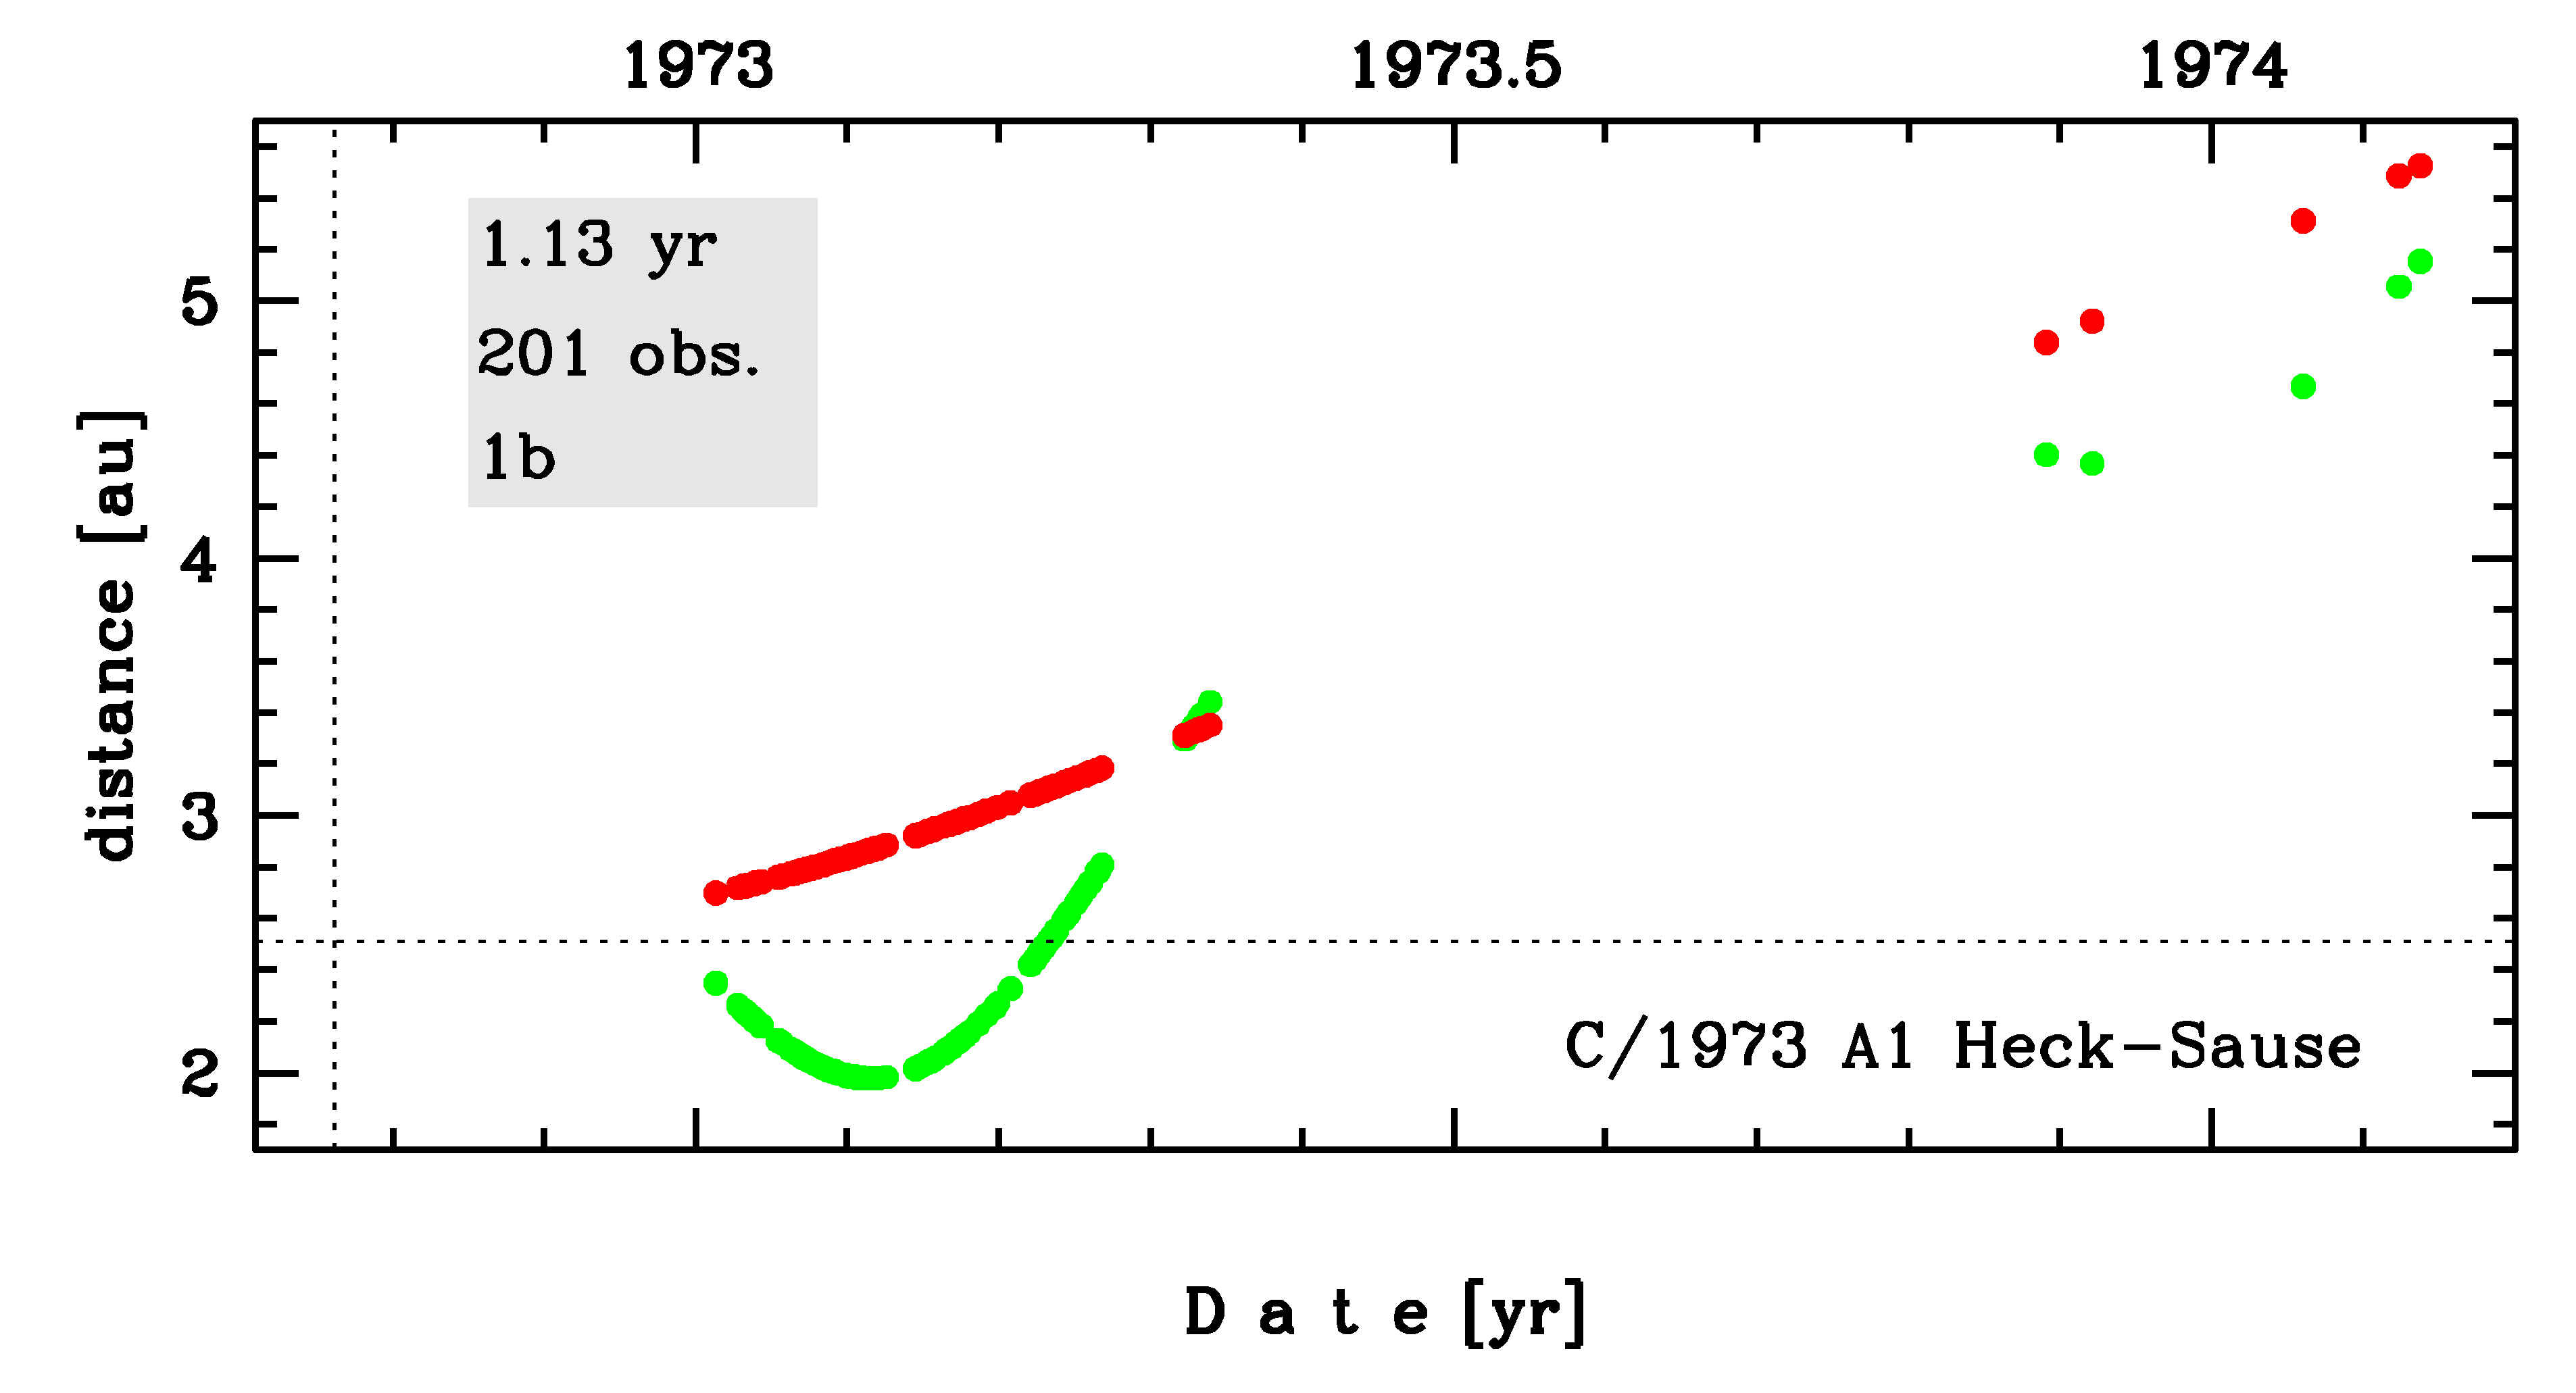
Time distribution of positional observations with corresponding heliocentric (red curve) and geocentric (green curve) distance at which they were taken. The horizontal dotted line shows the perihelion distance for a given comet whereas vertical dotted line — the moment of perihelion passage.
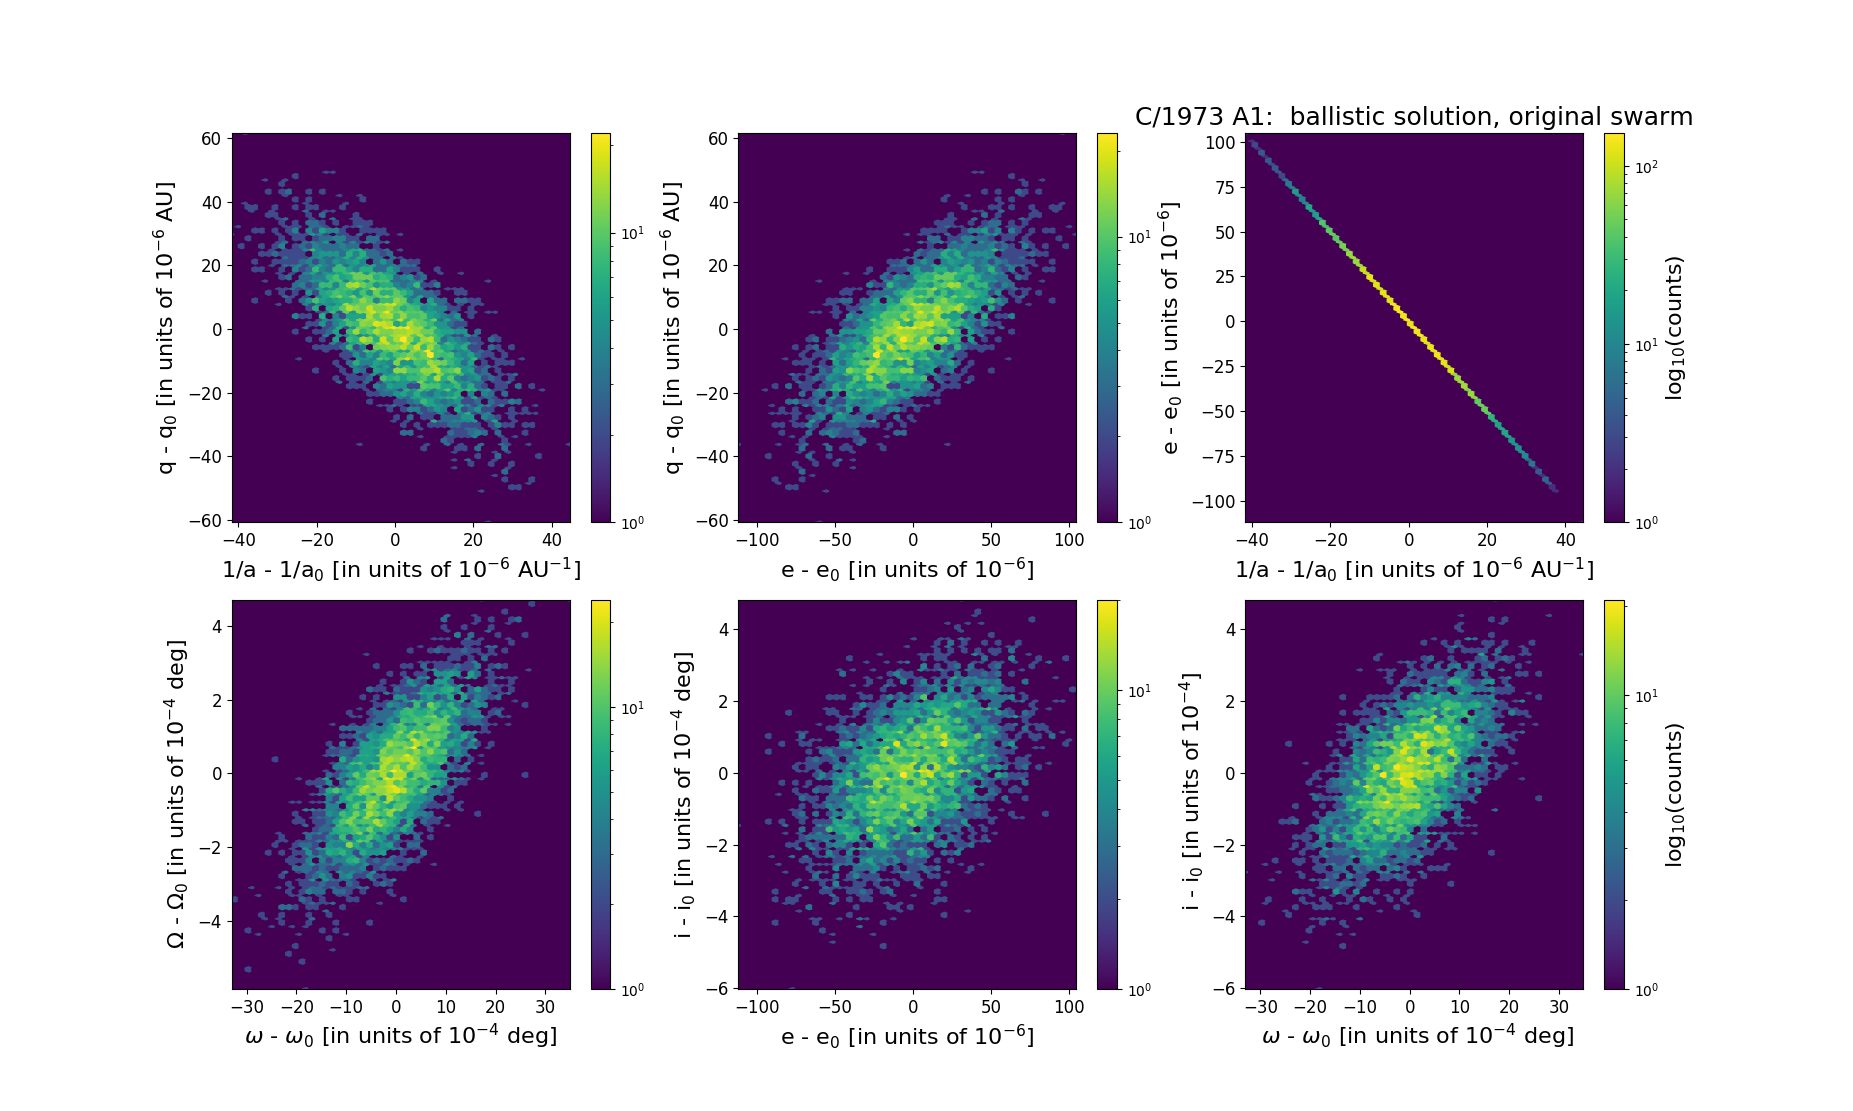
Six 2D-projections of the 6D space of original swarm including 5001 VCs. Each density map is given in logarithmic scale presented on the right in the individual panel.