C/1980 E1 Bowell
more info
Comet C/1980 E1 was discovered on 13 March 1980, two years before its perihelion passage, and was last seen on 30 December 1986 [Kronk and Meyer, Cometography: Volume 5]; later few prediscovery measurements going one month back to 11 February 1979 were found.
The comet made its closest approach to the Earth on 14 June 1982 (2.48 au), that was three months after its perihelion passage.
Solutions given here is based on data span over 6.88 yr in the range of heliocentric distances from: 7.47 au – 3.17 au (perihelion) – 13.91 au.
NG orbit using full data-arc is determinable.
Comet suffered strong planetary perturbations during its passage through the planetary system – the strongest ever noticed in the motion of actual near-parabolic comets. These perturbations lead to escape of the comet from the solar system on hiperbolic orbit with remarkable eccentricity of 1.054 (see future orbit).
See also Królikowska and Dones 2023, Królikowska and Dybczyński 2017,and Królikowska 2014.
| solution description | ||
|---|---|---|
| number of observations | 203 | |
| data interval | 1980 02 11 – 1986 12 30 | |
| data type | perihelion within the observation arc (FULL) | |
| data arc selection | entire data set (STD) | |
| range of heliocentric distances | 7.47 au – 3.36 au (perihelion) – 13.91 au | |
| type of model of motion | NS - non-gravitational orbits for standard g(r) | |
| data weighting | YES | |
| number of residuals | 387 | |
| RMS [arcseconds] | 1.06 | |
| orbit quality class | 1a+ | |
| orbital elements (barycentric ecliptic J2000) | ||
|---|---|---|
| Epoch | 2190 04 10 | |
| perihelion date | 1982 03 11.71042200 | ± 0.00109500 |
| perihelion distance [au] | 3.35597902 | ± 0.00001203 |
| eccentricity | 1.05373351 | ± 0.00000942 |
| argument of perihelion [°] | 134.961421 | ± 0.000948 |
| ascending node [°] | 114.562873 | ± 0.000896 |
| inclination [°] | 1.661948 | ± 0.000025 |
| reciprocal semi-major axis [10-6 au-1] | -16,011.28 | ± 2.77 |
| file containing 5001 VCs swarm |
|---|
| 1980e1n2.bpl |
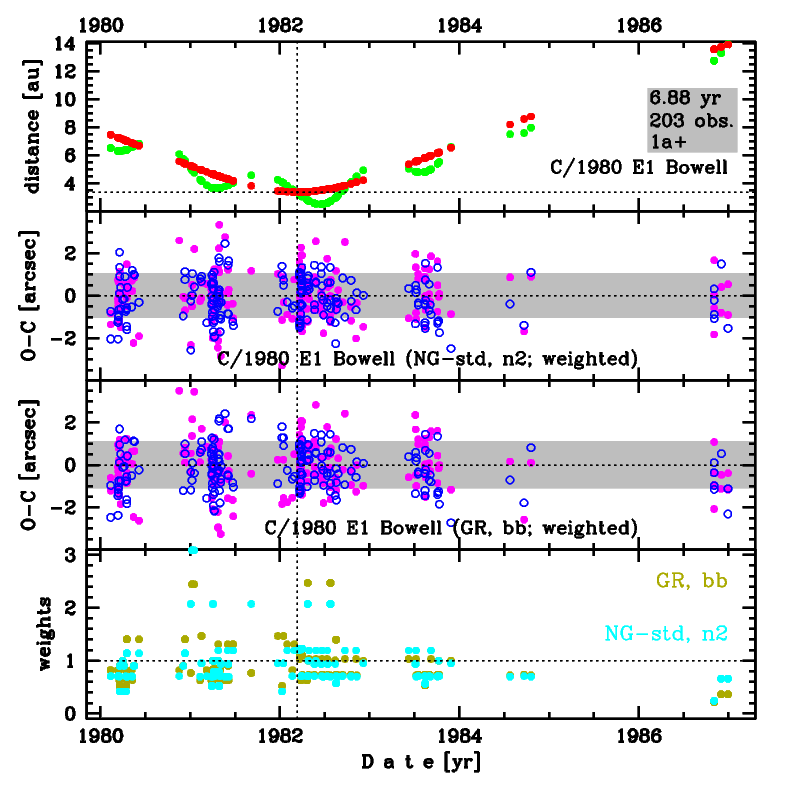
Upper panel: Time distribution of positional observations with corresponding heliocentric (red curve) and geocentric (green curve) distance at which they were taken. The horizontal dotted line shows the perihelion distance for a given comet whereas vertical dotted line — the moment of perihelion passage.
Middle panel(s): O-C diagram for a given solution (sometimes in comparison to another solution available in CODE), where residuals in right ascension are shown using magenta dots and in declination by blue open circles.
Lowest panel: Relative weights for a given data set(s).
Middle panel(s): O-C diagram for a given solution (sometimes in comparison to another solution available in CODE), where residuals in right ascension are shown using magenta dots and in declination by blue open circles.
Lowest panel: Relative weights for a given data set(s).
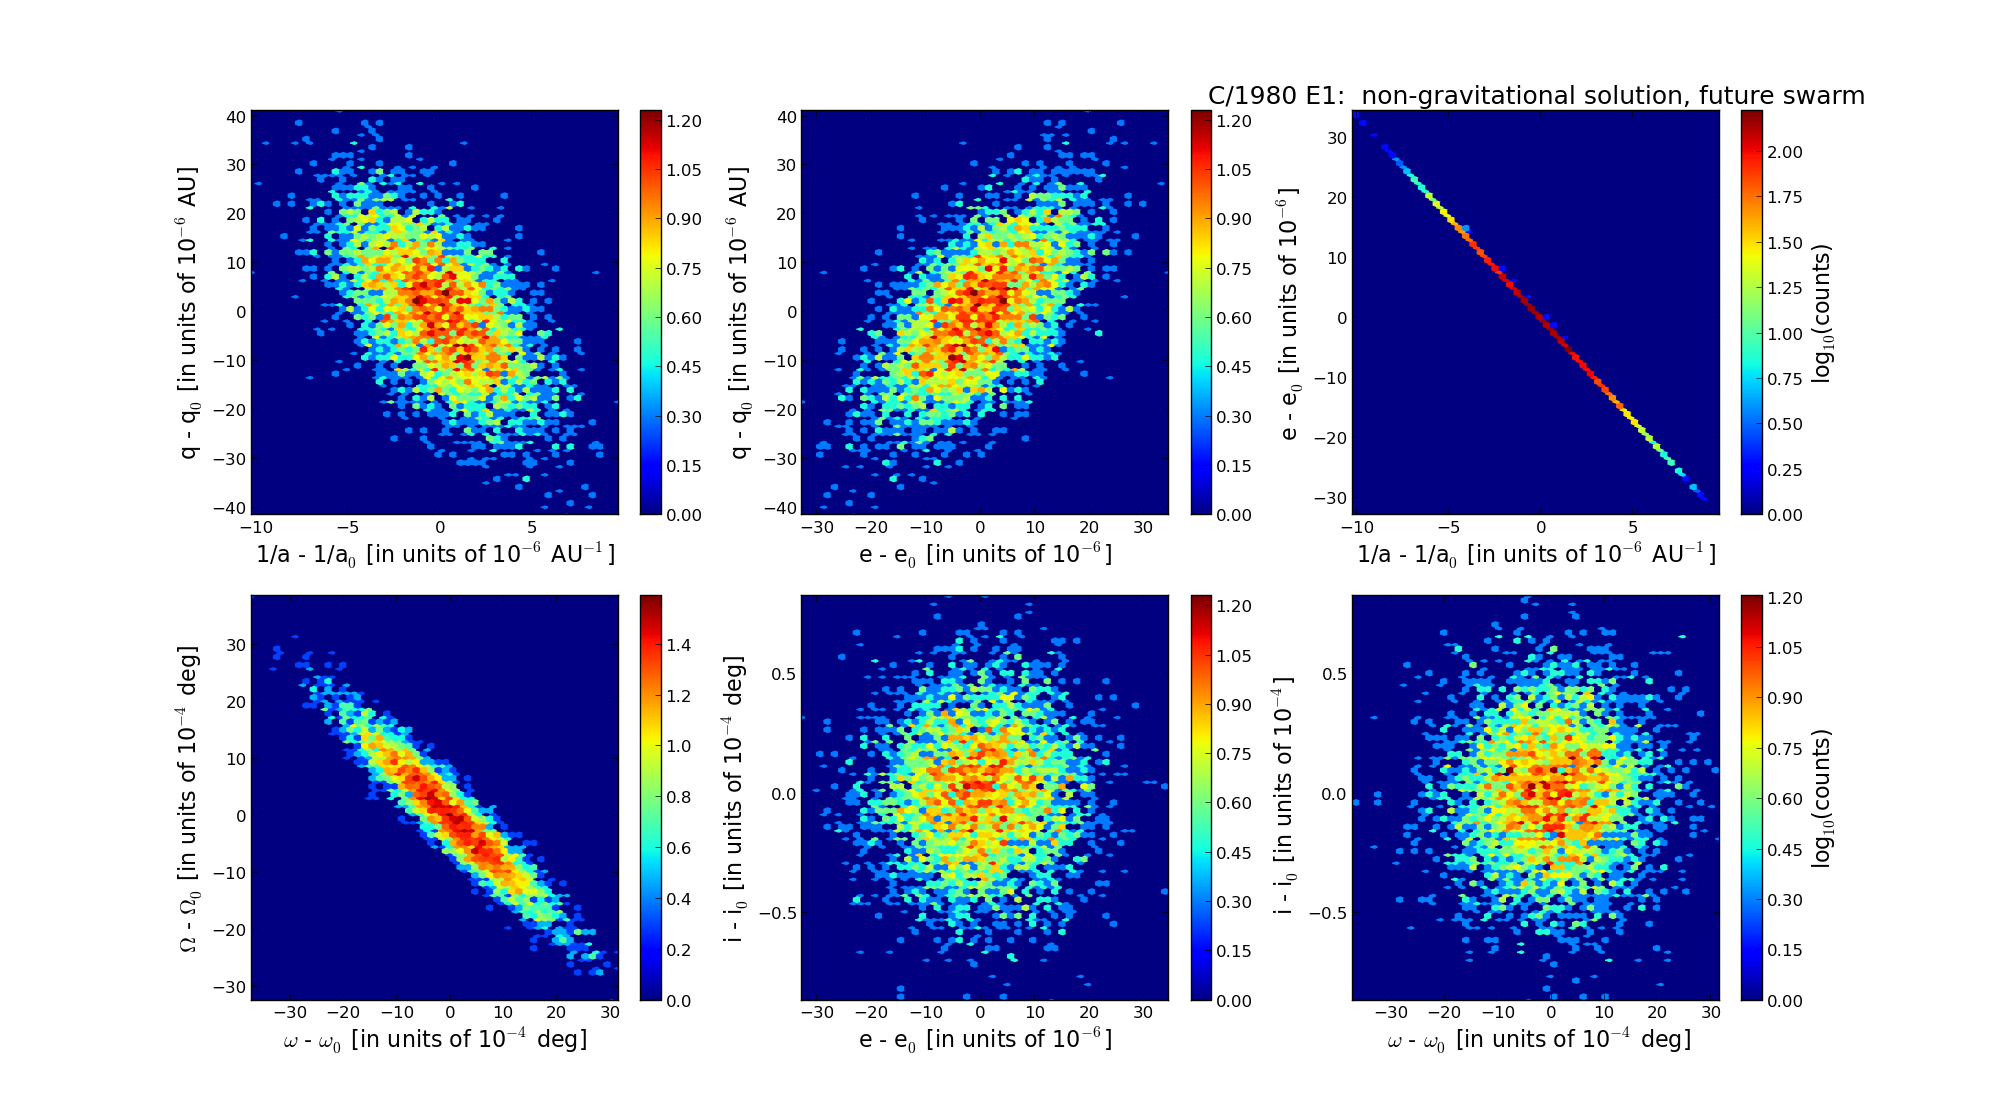
Six 2D-projections of the 6D space of future swarm including 5001 VCs. Each density map is given in logarithmic scale presented on the right in the individual panel.