C/1986 P1-A Wilson
more info
Comet C/1986 P1-A was discovered on 5 August 1986 by Christine Wilson (Mount Palomar, California, USA), that is 8.5 months before its perihelion passage.
This comet was last observed in mid-April 1989. Splitting event observed in comet Wilson was occured after perihelion passage.
Comet had its closest approach to the Earth on 1 May 1987 (0.623 au), less than two weeks after perihelion passage. According to Minor Planet Center, the main component A of this comet exhibits nongravitational acceleration in the time interval 5 August 1986 – 11 April 1989. Therefore, the non-gravitational orbit from the whole observational arc (spanning over 2.68 yr in a range of heliocentric distances: 3.64 au – 1.200 au (perihelion) – 7.83 au.) are given here as preferred orbit.
This Oort spike comet suffers large planetary perturbations during its passage through the planetary system; these perturbations lead to a more tight future orbit with semimajor axis of about 1,300 au.
See also Królikowska and Dybczyński 2010, Królikowska 2014 and Królikowska 2020.
| solution description | ||
|---|---|---|
| number of observations | 687 | |
| data interval | 1986 08 05 – 1989 04 11 | |
| data type | perihelion within the observation arc (FULL) | |
| data arc selection | entire data set (STD) | |
| range of heliocentric distances | 3.64 au – 1.20 au (perihelion) – 7.83 au | |
| type of model of motion | NS - non-gravitational orbits for standard g(r) | |
| data weighting | YES | |
| number of residuals | 1361 | |
| RMS [arcseconds] | 1.11 | |
| orbit quality class | 1a | |
| orbital elements (barycentric ecliptic J2000) | ||
|---|---|---|
| Epoch | 1688 05 11 | |
| perihelion date | 1987 04 20.10015174 | ± 0.00009717 |
| perihelion distance [au] | 1.19367382 | ± 0.00000164 |
| eccentricity | 0.99994987 | ± 0.00000235 |
| argument of perihelion [°] | 238.187130 | ± 0.000103 |
| ascending node [°] | 111.413536 | ± 0.000041 |
| inclination [°] | 147.182259 | ± 0.000028 |
| reciprocal semi-major axis [10-6 au-1] | 42.00 | ± 1.97 |
| file containing 5001 VCs swarm |
|---|
| 1986p1n1.bmi |
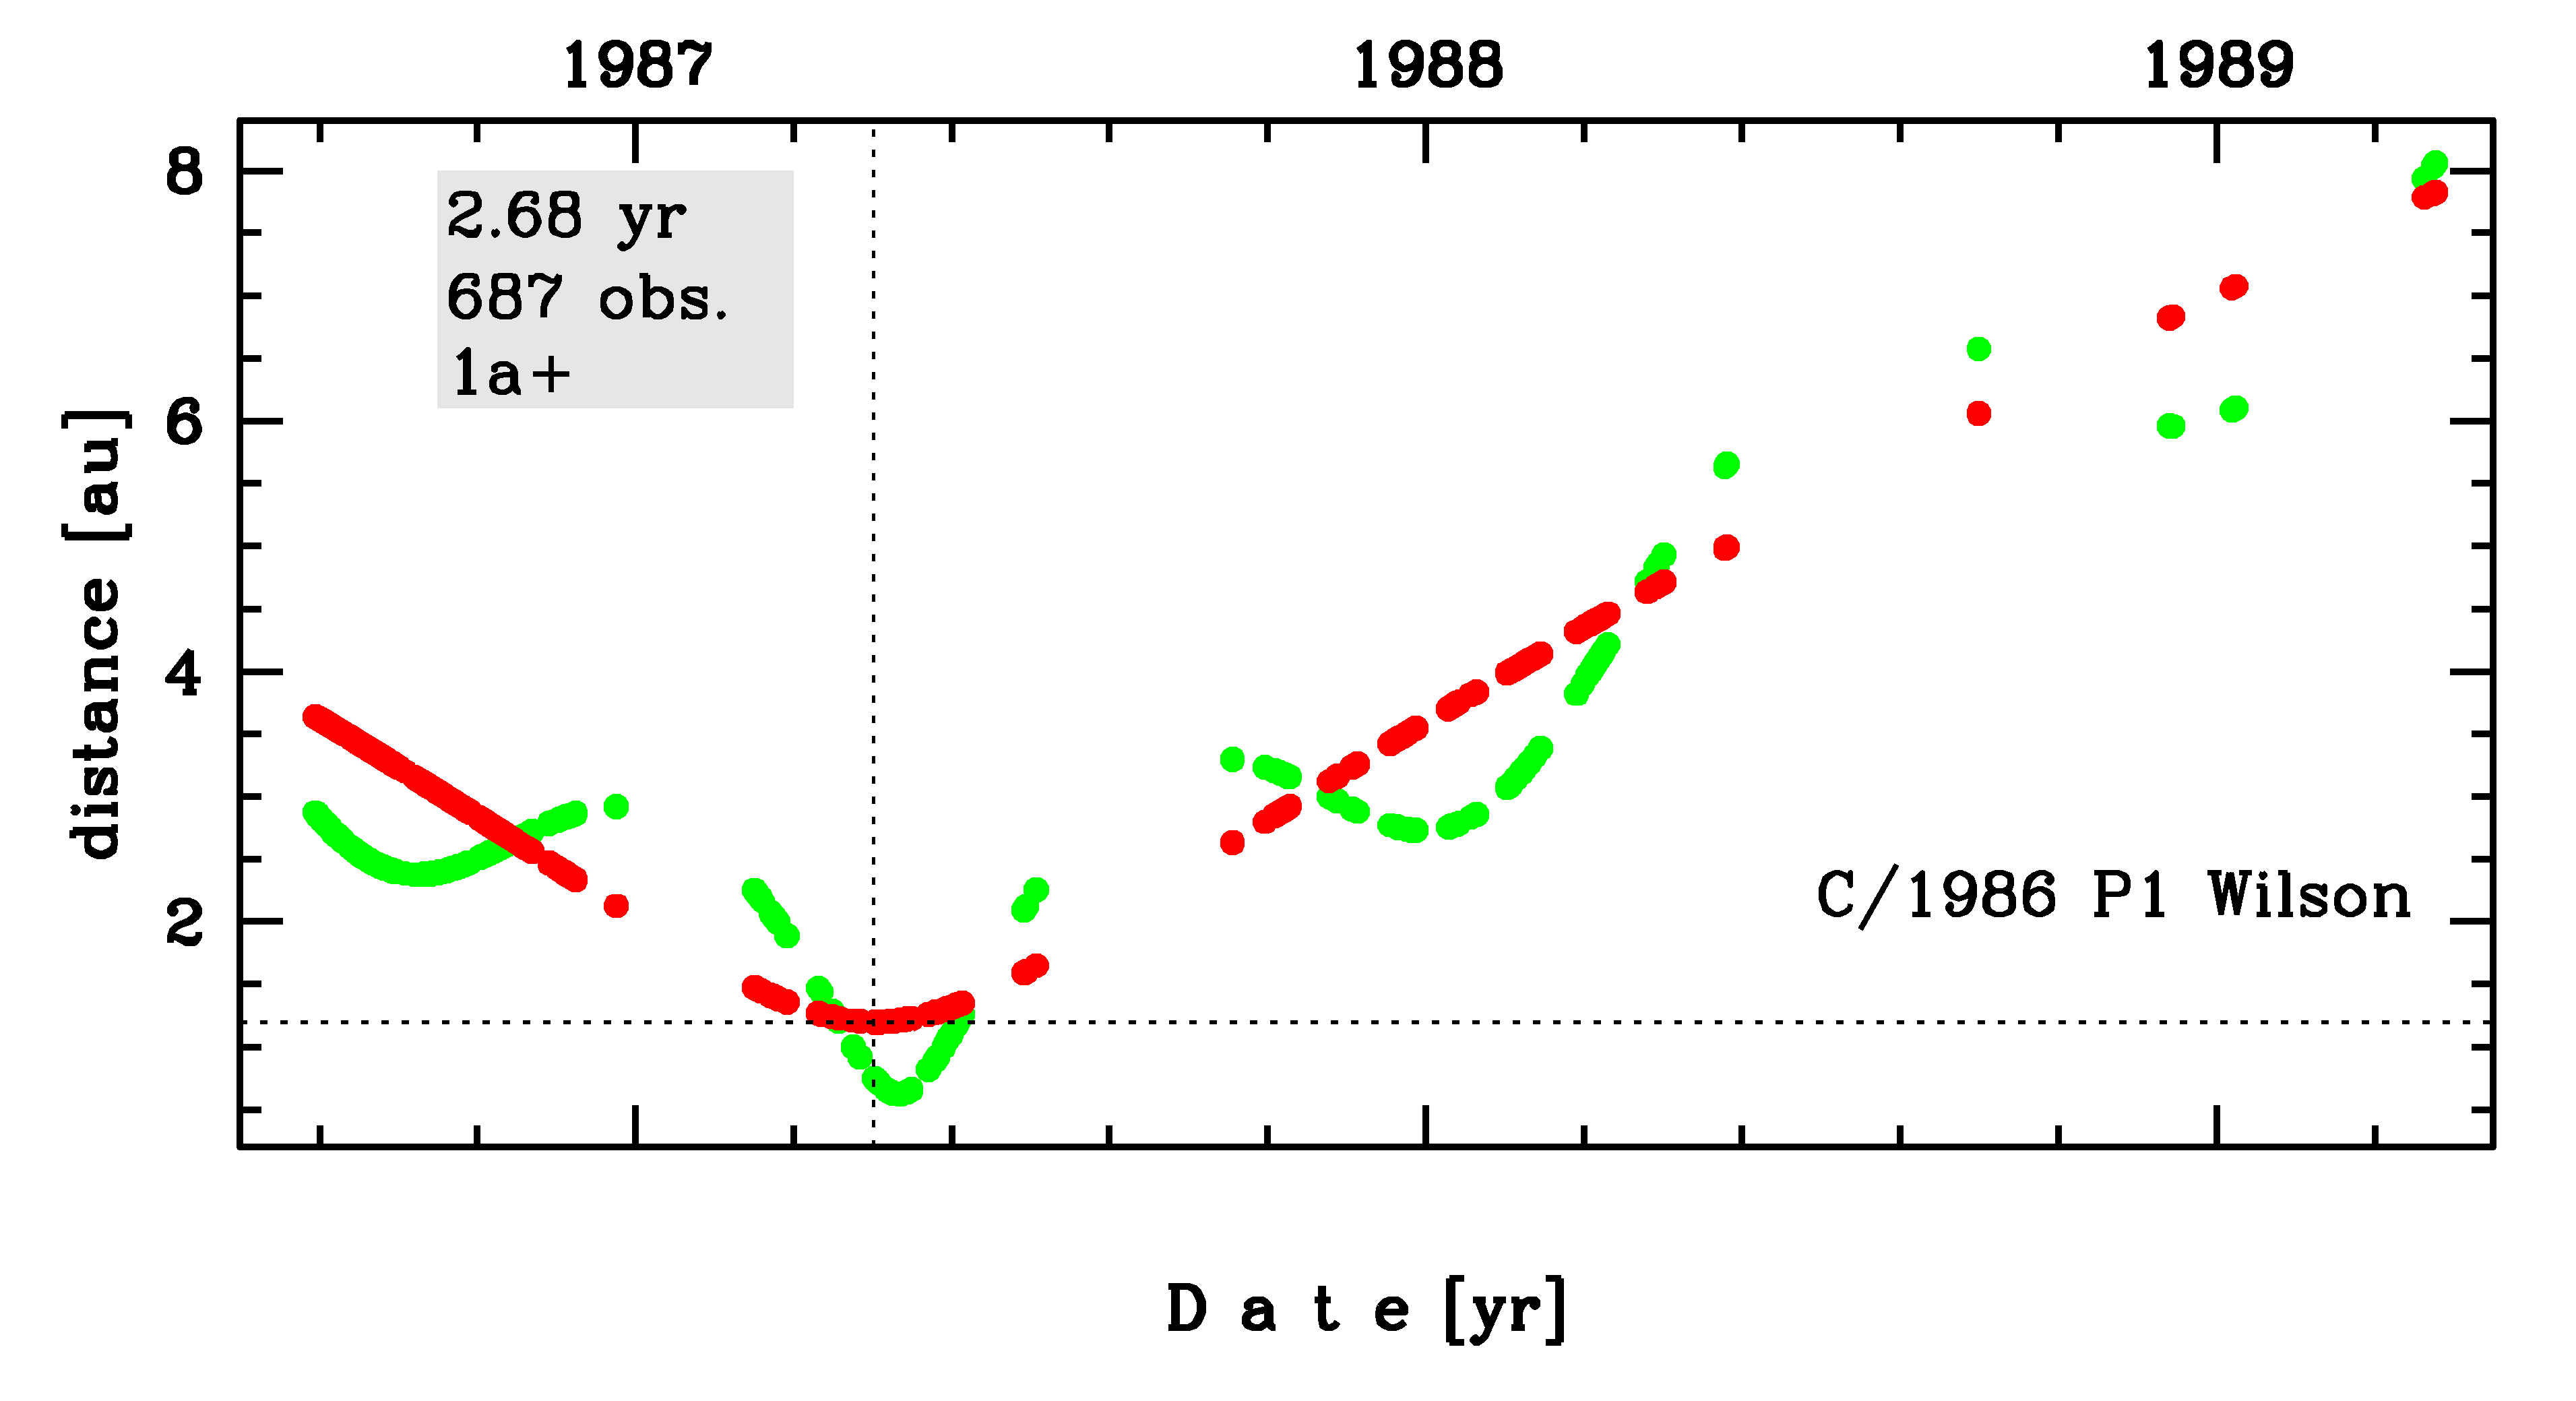
Time distribution of positional observations with corresponding heliocentric (red curve) and geocentric (green curve) distance at which they were taken. The horizontal dotted line shows the perihelion distance for a given comet whereas vertical dotted line — the moment of perihelion passage.

Six 2D-projections of the 6D space of original swarm including 5001 VCs. Each density map is given in logarithmic scale presented on the right in the individual panel.