C/1989 Q1 Okazaki-Levy-Rudenko
more info
Comet C/1989 Q1 was discovered independently by three observers: on 24 August 1989 by Kiyomi Okazaki with a 0.25m-Schmidt camera (Japan), and in the next two days visuallyby David Levy (Arizona) and Michael Rudenko (Massachusetts), that is about 2.5 months before its perihelion passage.This comet was last observed in late December 1989.
Comet had its closest approach to the Earth on 1 December 1989 (0.515 au), less than 3 weeks after perihelion passage.
This is a comet with nongravitational effects strongly manifested in positional data fitting.
Solutions given here are based on data spanning over 0.334 yr in a range of heliocentric distances: 1.63 au – 0.642 au (perihelion) – 1.08 au.
This Oort spike comet suffers tiny planetary perturbations during its passage through the planetary system; these perturbations lead to a little more tight future orbit (see preferred solution).
See also Królikowska 2014 and Królikowska 2020.
| solution description | ||
|---|---|---|
| number of observations | 231 | |
| data interval | 1989 08 24 – 1989 12 24 | |
| data type | significantly more measurements before perihelion (PRE+) | |
| data arc selection | entire data set (STD) | |
| range of heliocentric distances | 1.63 au – 0.64 au (perihelion) – 1.08 au | |
| type of model of motion | NS - non-gravitational orbits for standard g(r) | |
| data weighting | YES | |
| number of residuals | 452 | |
| RMS [arcseconds] | 1.30 | |
| orbit quality class | 2a | |
| orbital elements (barycentric ecliptic J2000) | ||
|---|---|---|
| Epoch | 1691 11 12 | |
| perihelion date | 1989 11 10.99772364 | ± 0.00039173 |
| perihelion distance [au] | 0.64067579 | ± 0.00000348 |
| eccentricity | 0.99997251 | ± 0.00001425 |
| argument of perihelion [°] | 150.615177 | ± 0.000450 |
| ascending node [°] | 275.483828 | ± 0.000276 |
| inclination [°] | 89.973369 | ± 0.000251 |
| reciprocal semi-major axis [10-6 au-1] | 42.90 | ± 22.24 |
| file containing 5001 VCs swarm |
|---|
| 1989q1n1.bmi |
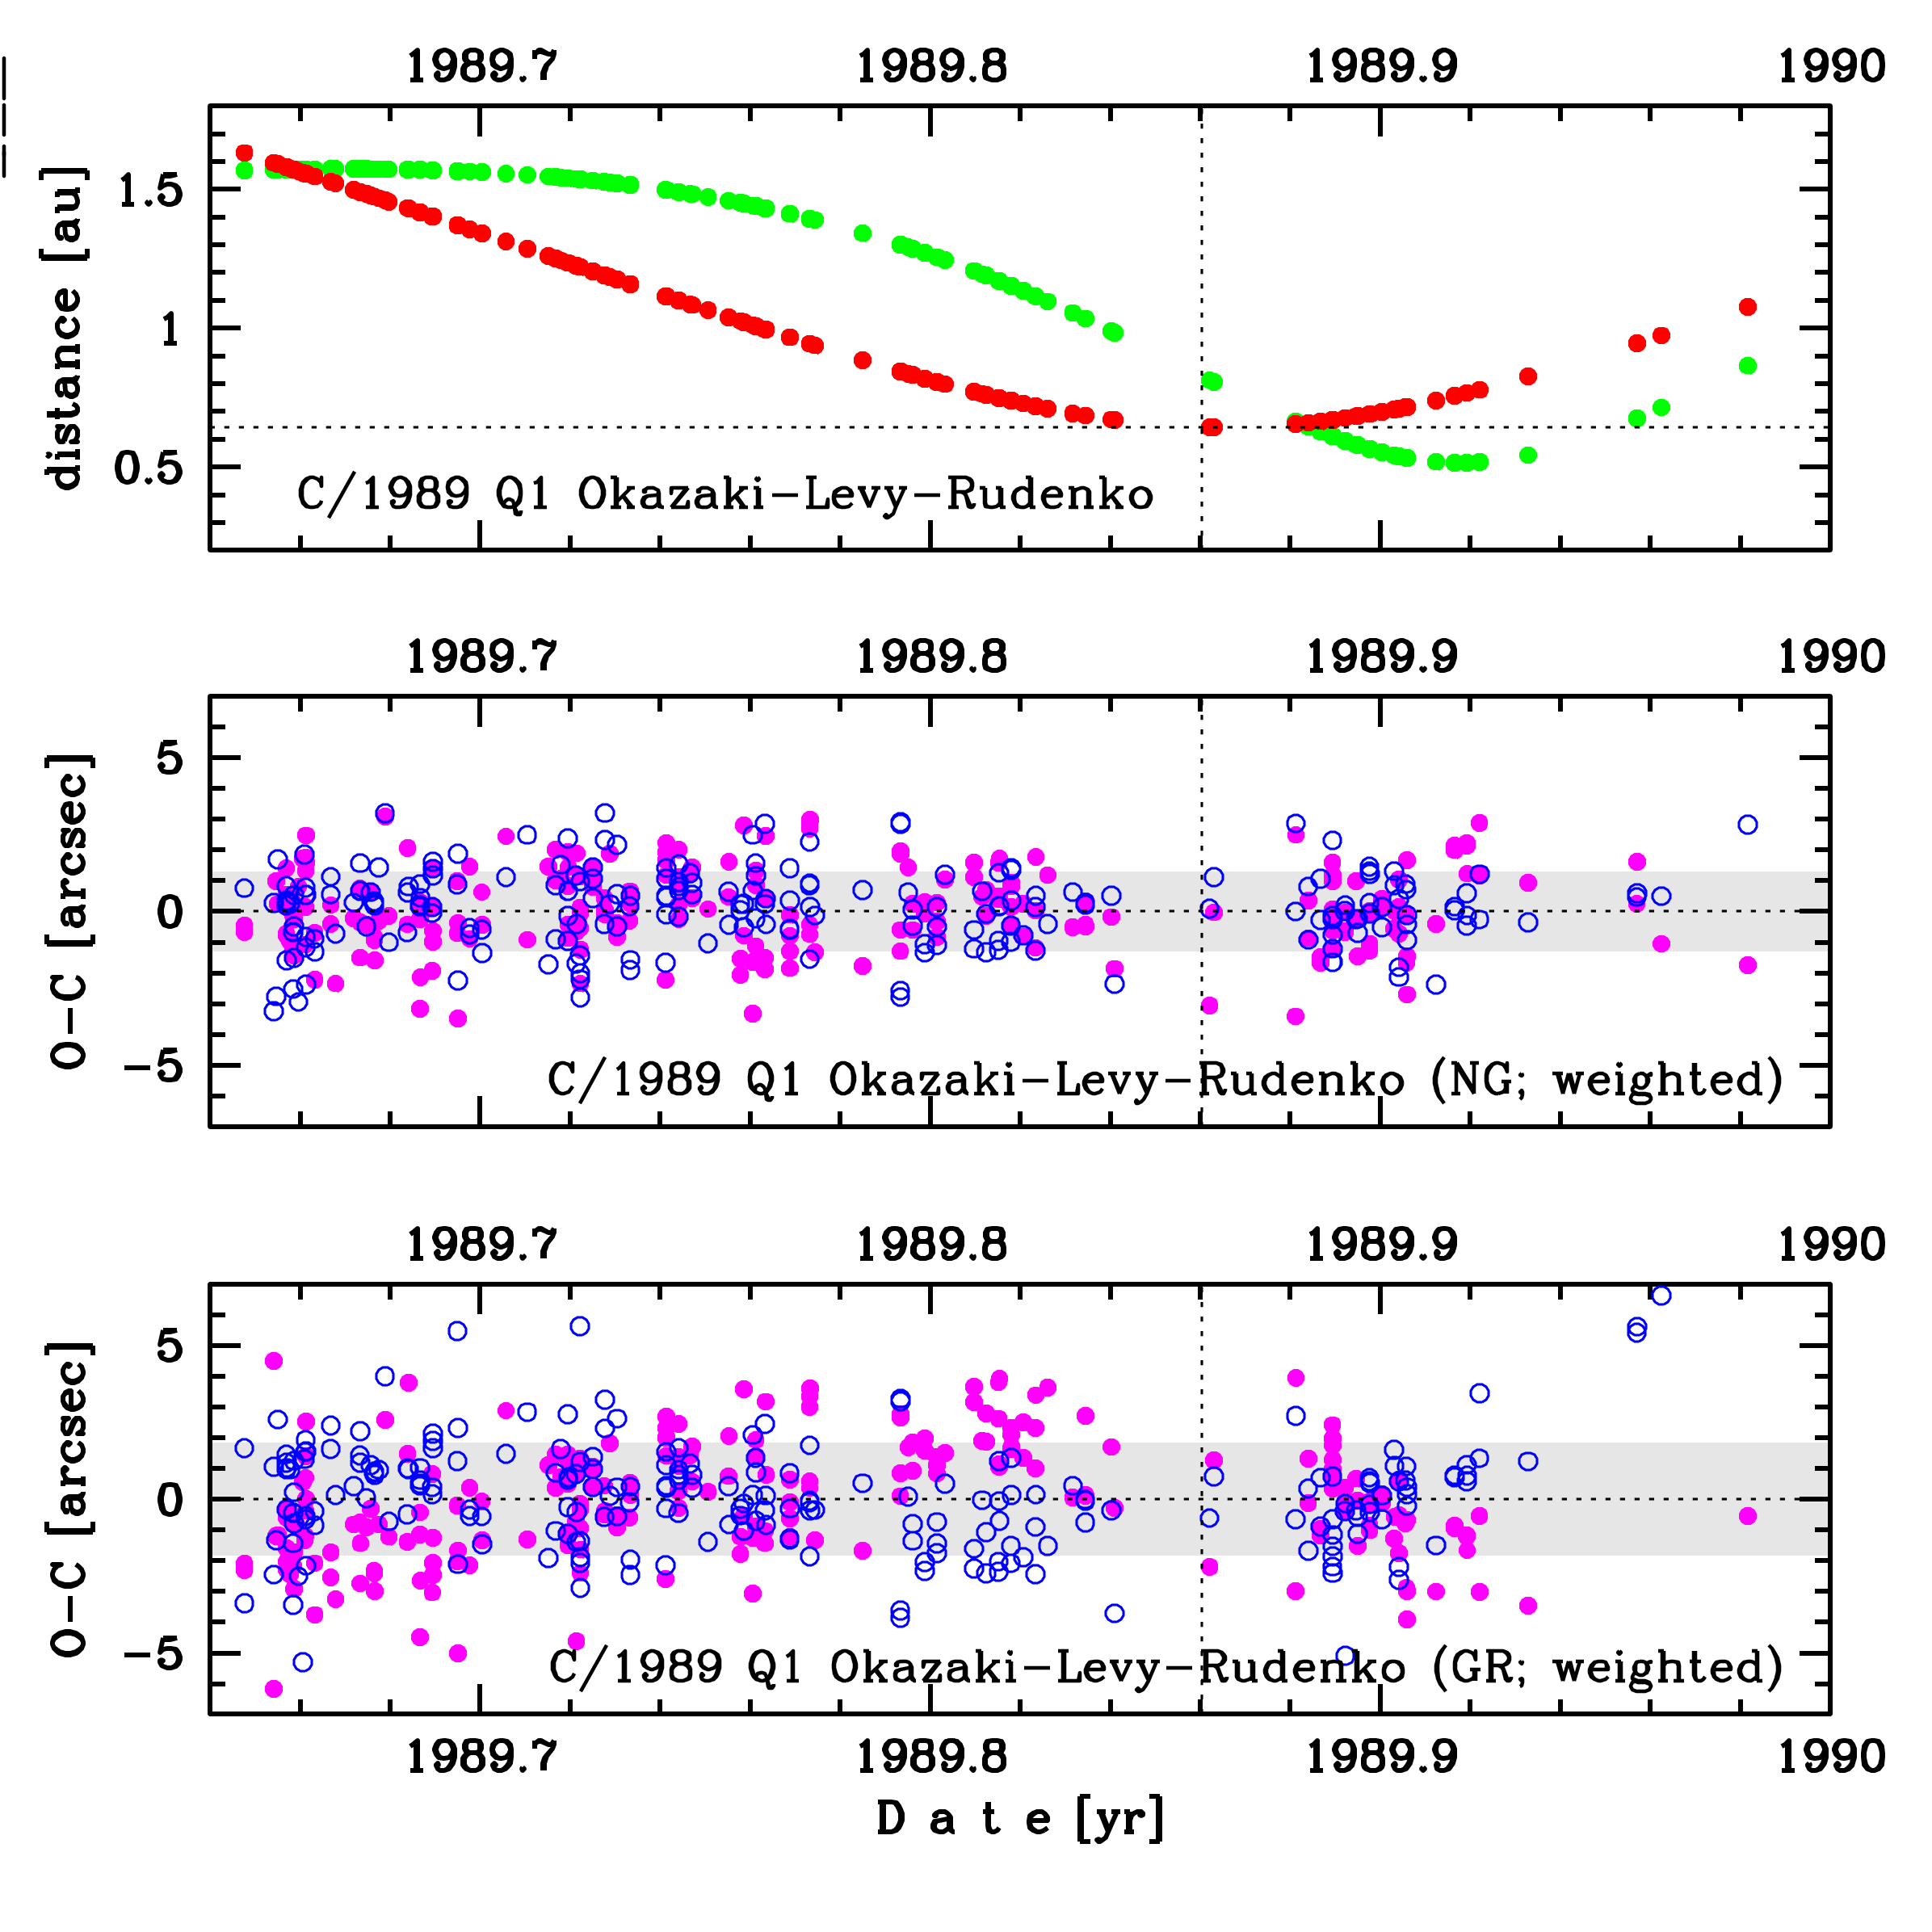
Upper panel: Time distribution of positional observations with corresponding heliocentric (red curve) and geocentric (green curve) distance at which they were taken. The horizontal dotted line shows the perihelion distance for a given comet whereas vertical dotted line — the moment of perihelion passage.
Lower panel (panels): O-C diagram for this(two) solution (solutions) given in this database, where residuals in right ascension are shown using magenta dots and in declination by blue open circles.
Lower panel (panels): O-C diagram for this(two) solution (solutions) given in this database, where residuals in right ascension are shown using magenta dots and in declination by blue open circles.
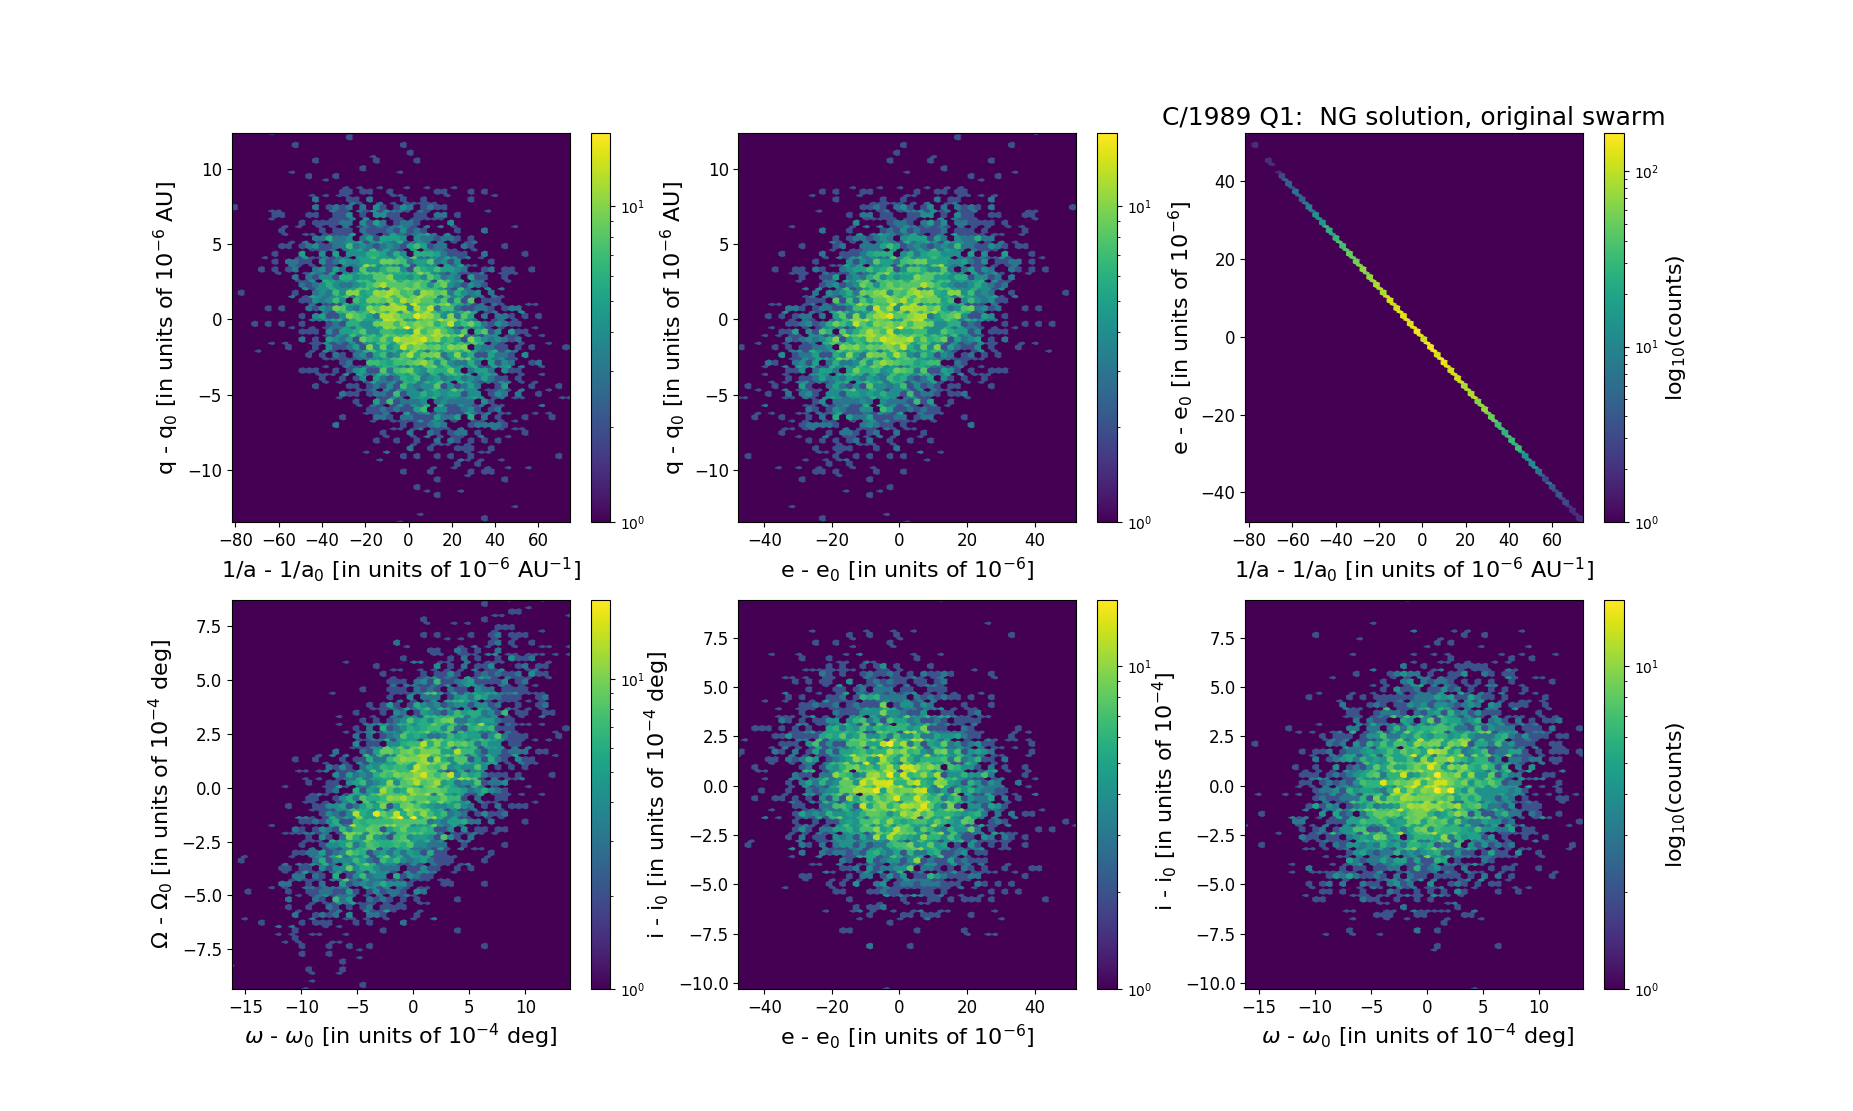
Six 2D-projections of the 6D space of original swarm including 5001 VCs. Each density map is given in logarithmic scale presented on the right in the individual panel.