C/1990 K1 Levy
more info
Comet C/1990 K1 was discovered on 20 May 1990 by David Levy (Arizona), that is about 5 months before its perihelion passage. This comet was last observed at the beginning of April 1992.
Comet had its closest approach to the Earth on 26 August 1990 (0.430 au), less than 2 months before perihelion passage.
This is a comet with nongravitational effects strongly manifested in positional data fitting.
Preferred solution given here is based on data spanning over 1.86 yr in a range of heliocentric distances: 2.57 au – 0.939 au (perihelion) – 6.36 au. However, also two other non-gravitational solutions are given: bn solution based on pre-perihelion data, and rn solution based on post-perihelion data.
This comet with semimajor axis of about 10,000 au (preferred orbit) or even shorter (see solution bn) suffers rather large planetary perturbations during its passage through the planetary system; these perturbations lead to escape the comet on hyperbolic orbit from the planetary zone.
See also Królikowska 2014 and Królikowska 2020.
| solution description | ||
|---|---|---|
| number of observations | 590 | |
| data interval | 1990 05 21 – 1990 10 21 | |
| data arc selection | data generally limited to pre-perihelion (PRE) | |
| range of heliocentric distances | 2.57 au – 0.94au | |
| type of model of motion | NS - non-gravitational orbits for standard g(r) | |
| data weighting | YES | |
| number of residuals | 1144 | |
| RMS [arcseconds] | 0.92 | |
| orbit quality class | 2b | |
| previous orbit statistics, both Galactic and stellar perturbations were taken into account | ||
|---|---|---|
| no. of returning VCs in the swarm | 5001 | * |
| no. of escaping VCs in the swarm | 0 | |
| no. of hyperbolas among escaping VCs in the swarm | 0 | |
| previous reciprocal semi-major axis [10-6 au-1] | 355.46 – 449.99 – 542.53 | |
| previous perihelion distance [au] | 0.93913 – 0.93934 – 0.93953 | |
| previous aphelion distance [103 au] | 3.7 – 4.4 – 5.6 | |
| time interval to previous perihelion [Myr] | 0.079 – 0.1 – 0.15 | |
| percentage of VCs with qprev < 10 | 100 | |
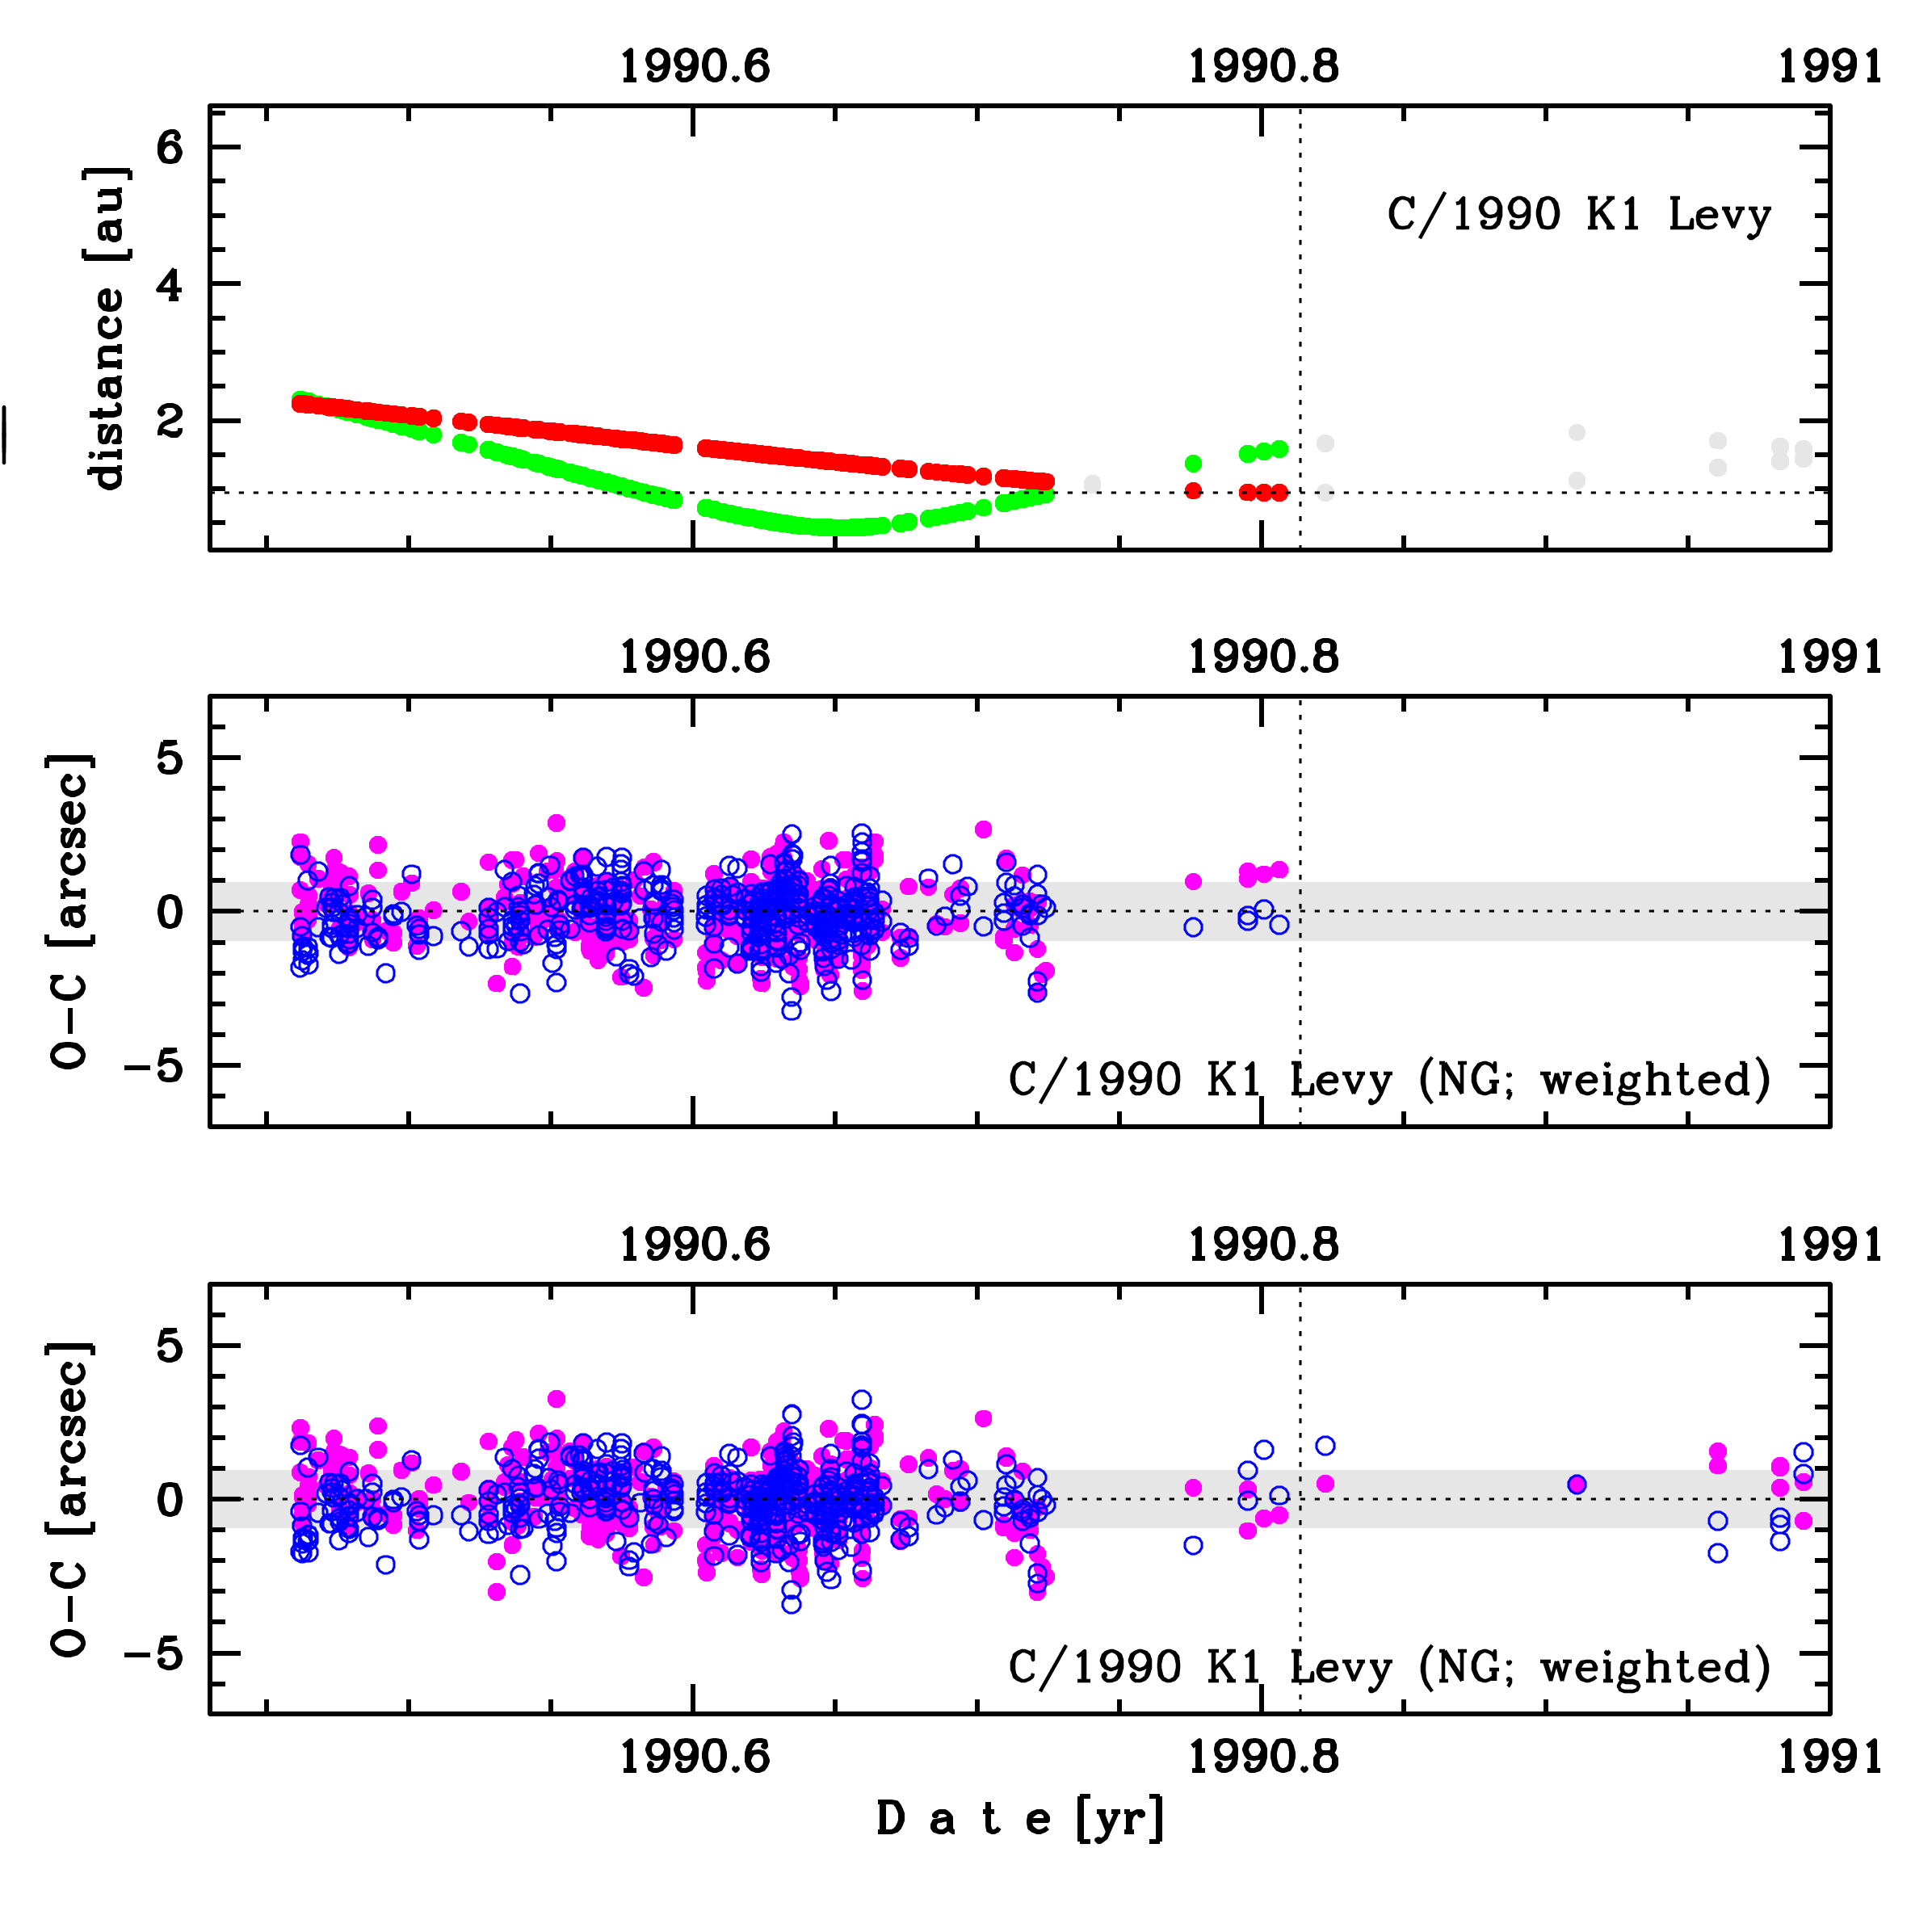
Upper panel: Time distribution of positional observations with corresponding heliocentric (red curve) and geocentric (green curve) distance at which they were taken. The horizontal dotted line shows the perihelion distance for a given comet whereas vertical dotted line — the moment of perihelion passage.
Lower panel (panels): O-C diagram for this(two) solution (solutions) given in this database, where residuals in right ascension are shown using magenta dots and in declination by blue open circles.
Lower panel (panels): O-C diagram for this(two) solution (solutions) given in this database, where residuals in right ascension are shown using magenta dots and in declination by blue open circles.
| previous_g orbit statistics, here only the Galactic tide has been included | ||
|---|---|---|
| no. of returning VCs in the swarm | 5001 | * |
| no. of escaping VCs in the swarm | 0 | |
| no. of hyperbolas among escaping VCs in the swarm | 0 | |
| previous reciprocal semi-major axis [10-6 au-1] | 355.46 – 449.99 – 542.53 | |
| previous perihelion distance [au] | 0.938921 – 0.939074 – 0.939124 | |
| previous aphelion distance [103 au] | 3.7 – 4.4 – 5.6 | |
| time interval to previous perihelion [Myr] | 0.079 – 0.1 – 0.15 | |
| percentage of VCs with qprev < 10 | 100 | |