C/1991 X2 Mueller
more info
Comet C/1991 X2 was discovered on 13 December 1991 by Jean Mueller (Palomar Sky Survey II), that is more than 3 months before its perihelion passage. This comet was observed only before its perihelion passage until the beginning of March 1992.
Comet had its closest approach to the Earth on 1 February 1992 (0.557 au), 1.5 month after its discovery.
Solutions given here are based on data spanning over 0.222 yr in a range of heliocentric distances from 2.17 au to 0.61 au. Despite a short arc of data, nongravitational orbits can be determined and results on decresing of RMS from 1.26 to 1.12 arcsec; however, NG orbits are very poor quality and uncertainty of transverse NG parameter is relatively large. It should be noted that the evolution of non-gravitational orbits is completely different than that of pure gravitational orbit.
According to preferred solution, this Oort spike comet seems to suffer moderate planetary perturbations during its passage through the planetary system; these perturbations can lead to a more tight future orbit assuming that this comet survived its perihelion passage. However, Sekanina (2019) speculates that this comet may not have survived the perihelion passage.
See also Królikowska 2020.
| solution description | ||
|---|---|---|
| number of observations | 154 | |
| data interval | 1991 12 13 – 1992 03 03 | |
| data type | observed only before perihelion (PRE) | |
| data arc selection | entire data set (STD) | |
| range of heliocentric distances | 2.17 au – 0.61au | |
| type of model of motion | NS - non-gravitational orbits for standard g(r) | |
| data weighting | YES | |
| number of residuals | 299 | |
| RMS [arcseconds] | 1.12 | |
| orbit quality class | 3a | |
| orbital elements (barycentric ecliptic J2000) | ||
|---|---|---|
| Epoch | 1694 05 20 | |
| perihelion date | 1992 03 21.02011812 | ± 0.00384376 |
| perihelion distance [au] | 0.19685629 | ± 0.00003624 |
| eccentricity | 0.99998084 | ± 0.00003953 |
| argument of perihelion [°] | 307.095637 | ± 0.006967 |
| ascending node [°] | 288.613554 | ± 0.002834 |
| inclination [°] | 95.827957 | ± 0.011802 |
| reciprocal semi-major axis [10-6 au-1] | 97.31 | ± 200.85 |
| file containing 5001 VCs swarm |
|---|
| 1991x2n5.bmi |
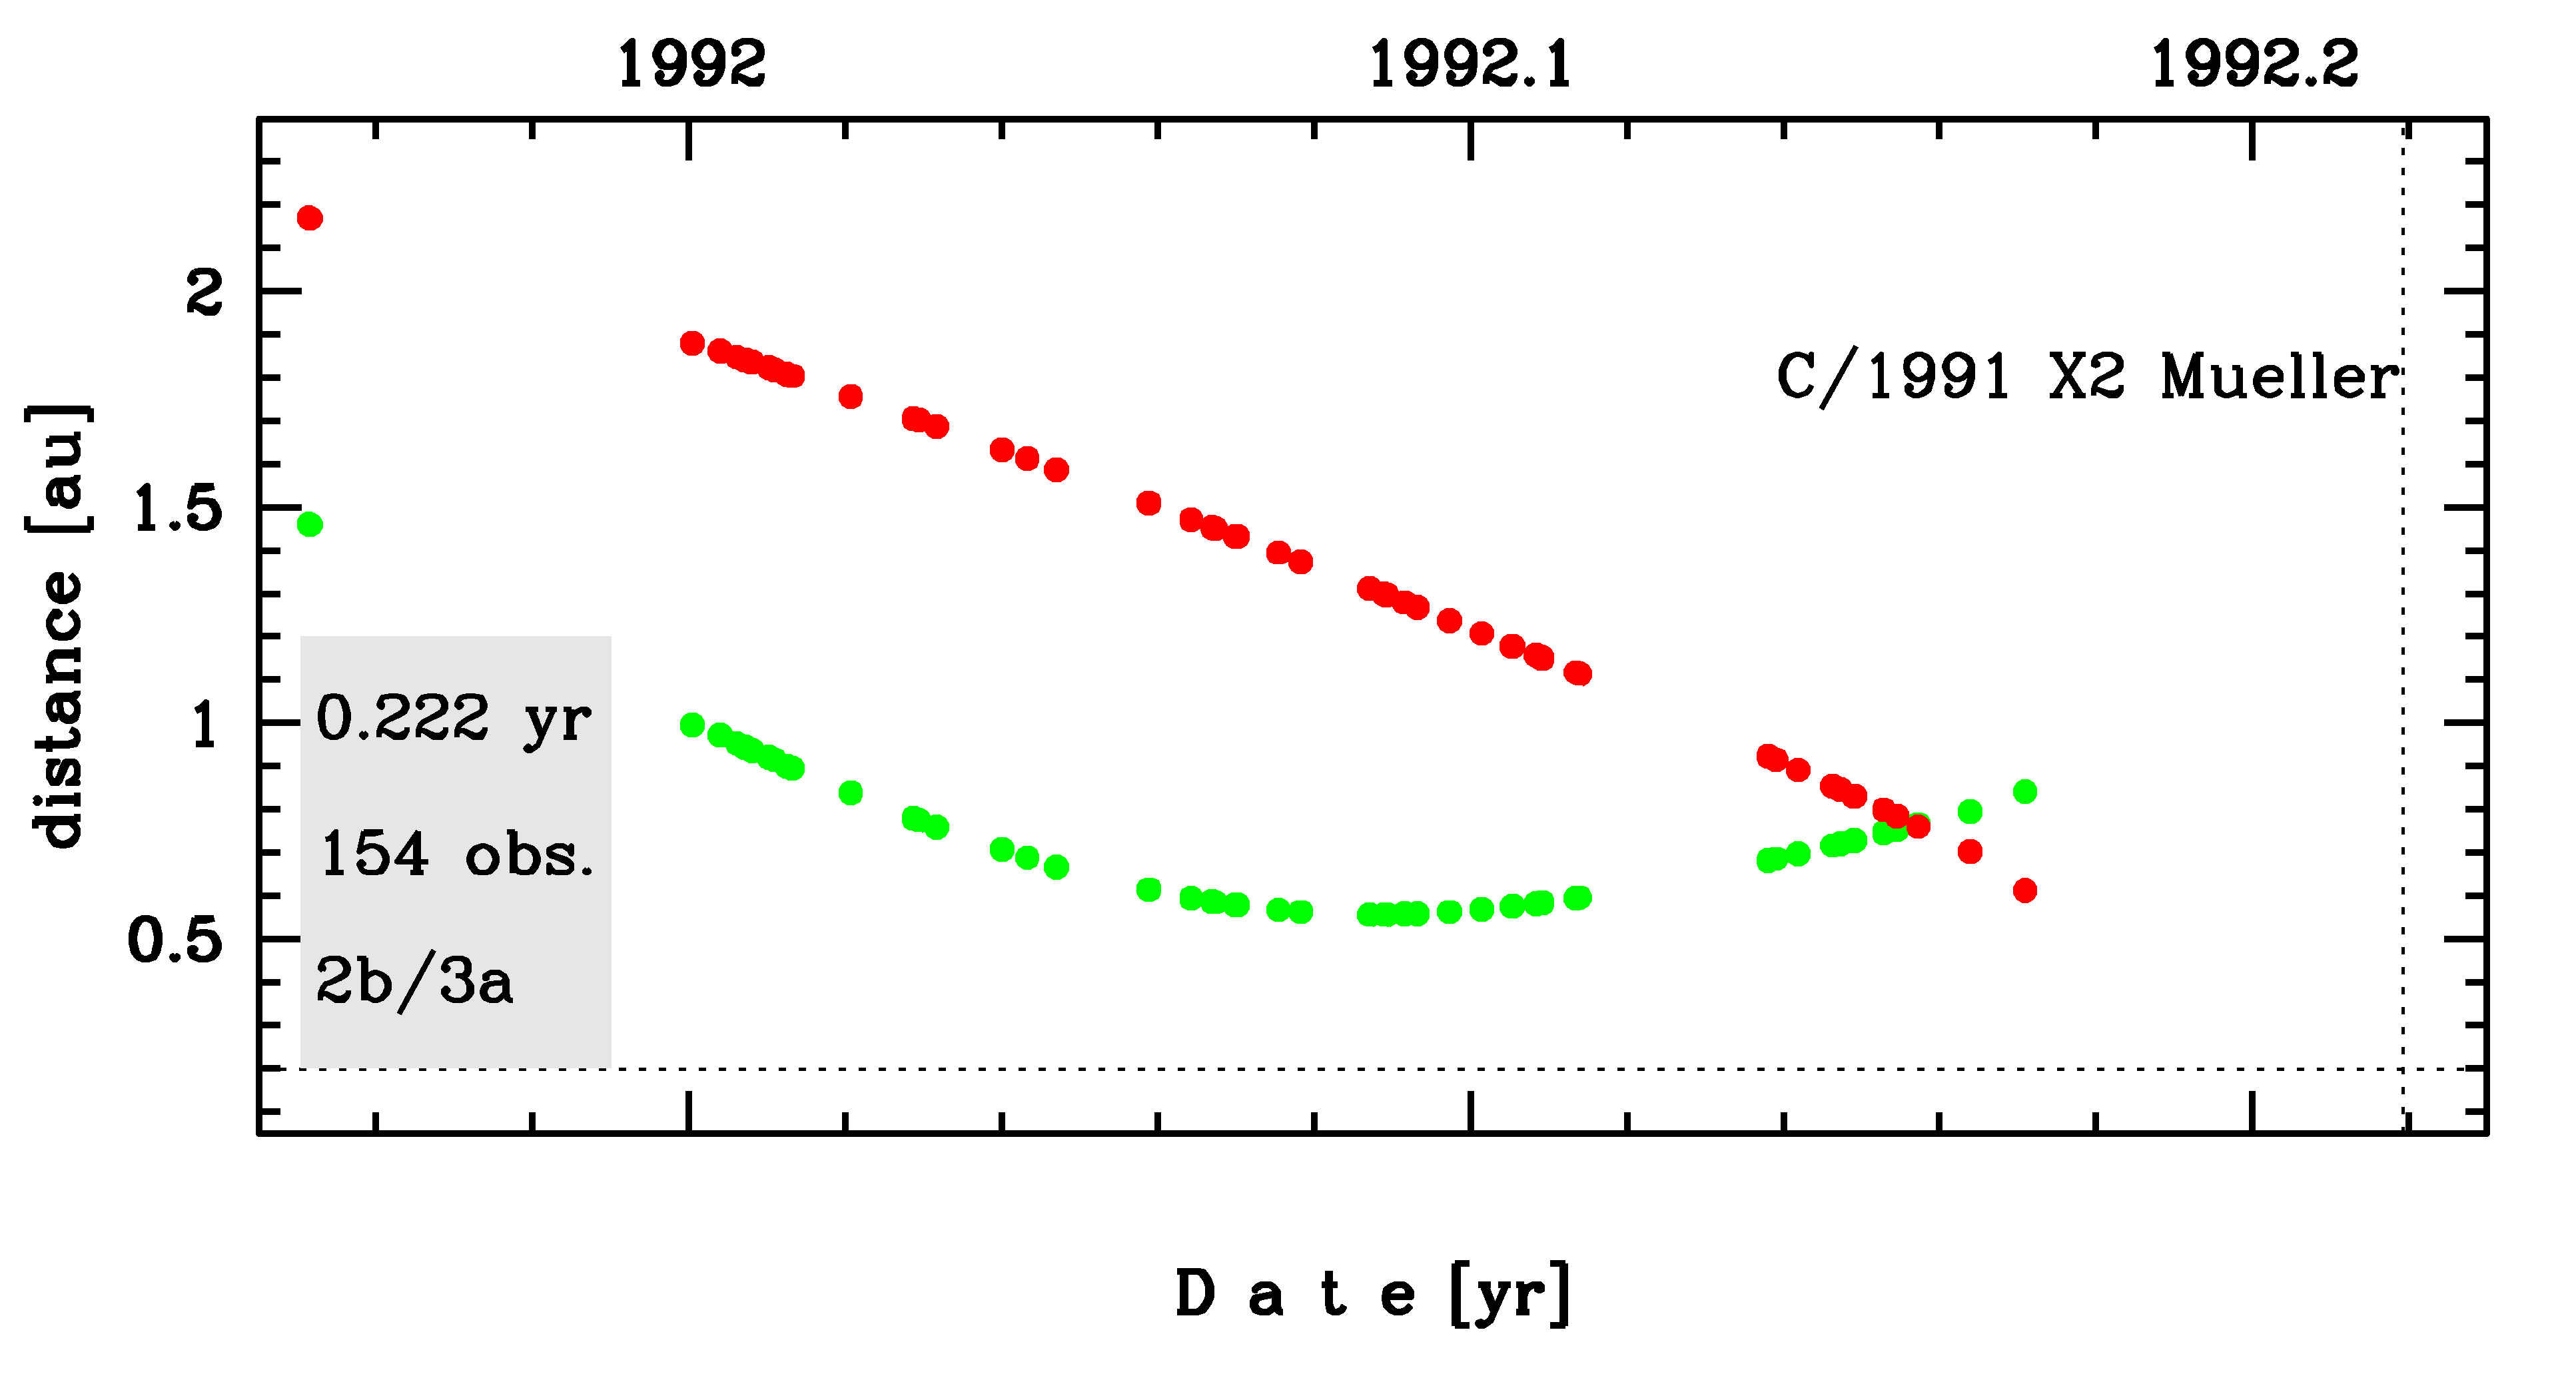
Time distribution of positional observations with corresponding heliocentric (red curve) and geocentric (green curve) distance at which they were taken. The horizontal dotted line shows the perihelion distance for a given comet whereas vertical dotted line — the moment of perihelion passage.

Six 2D-projections of the 6D space of original swarm including 5001 VCs. Each density map is given in logarithmic scale presented on the right in the individual panel.