C/1992 A1 Helin-Alu
more info
Comet C/1992 A1 was discovered on 9 January 1992 by Eleanor F. Helin and Jeff Alu during the course of the near-Earth asteroid survey (Mount Palomar, California, USA),that is about 6 months before its perihelion passage. This comet was last observed in the second half of March 1993.
Comet had its closest approach to the Earth on 6 February 1992 (2.448 au), about a month after its discovery.
Solution given here is based on data spanning over 1.20 yr in a range of heliocentric distances: 3.50 au – 3.02 au (perihelion) – 3.92 au.
This Oort spike comet suffers tiny planetary perturbations during its passage through the planetary system; however, these perturbations lead to escape the comet on hyperbolic orbit from the planetary zone.
See also Królikowska 2020.
| solution description | ||
|---|---|---|
| number of observations | 56 | |
| data interval | 1992 01 09 – 1993 03 23 | |
| data type | perihelion within the observation arc (FULL) | |
| data arc selection | entire data set (STD) | |
| range of heliocentric distances | 3.5 au – 3.02 au (perihelion) – 3.92 au | |
| detectability of NG effects in the comet's motion | NG effects not determinable | |
| type of model of motion | GR - gravitational orbit | |
| data weighting | NO | |
| number of residuals | 107 | |
| RMS [arcseconds] | 1.34 | |
| orbit quality class | 1b | |
| orbital elements (barycentric ecliptic J2000) | ||
|---|---|---|
| Epoch | 1690 05 01 | |
| perihelion date | 1992 07 09.86001530 | ± 0.00619148 |
| perihelion distance [au] | 3.00788450 | ± 0.00002359 |
| eccentricity | 0.99987088 | ± 0.00006989 |
| argument of perihelion [°] | 240.114133 | ± 0.001256 |
| ascending node [°] | 288.910208 | ± 0.000161 |
| inclination [°] | 39.308702 | ± 0.000229 |
| reciprocal semi-major axis [10-6 au-1] | 42.93 | ± 23.24 |
| file containing 5001 VCs swarm |
|---|
| 1992a1a1.bmi |
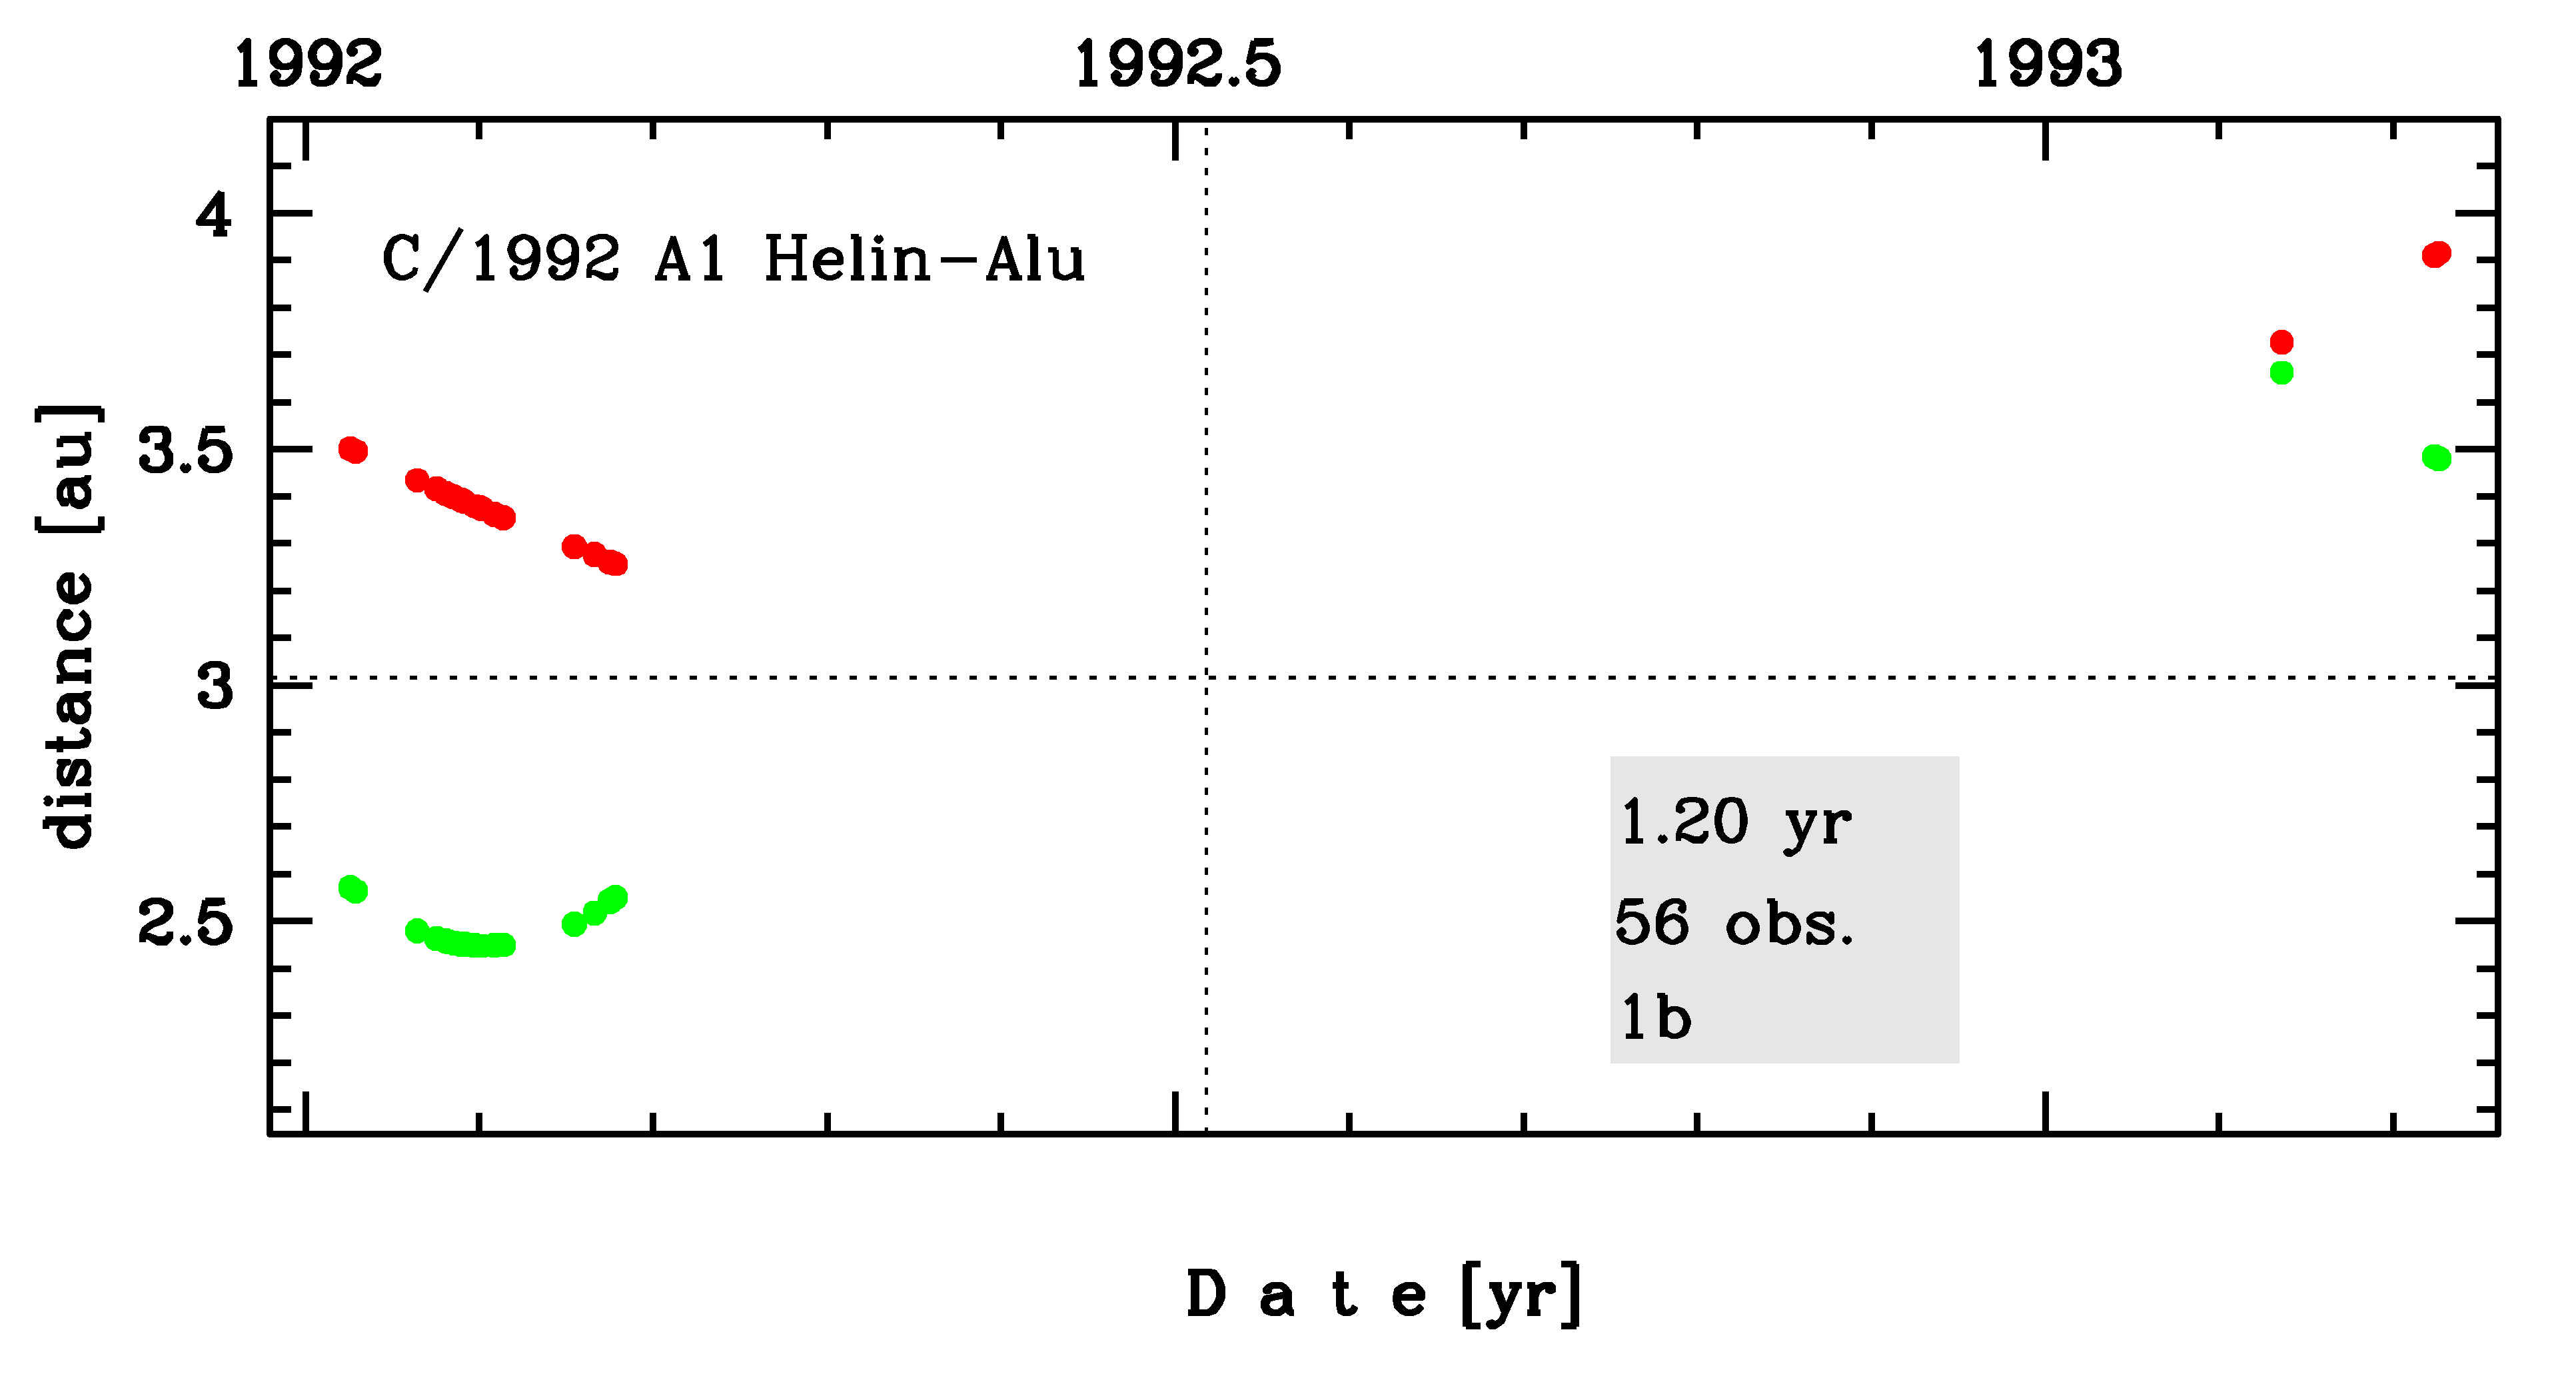
Time distribution of positional observations with corresponding heliocentric (red curve) and geocentric (green curve) distance at which they were taken. The horizontal dotted line shows the perihelion distance for a given comet whereas vertical dotted line — the moment of perihelion passage.
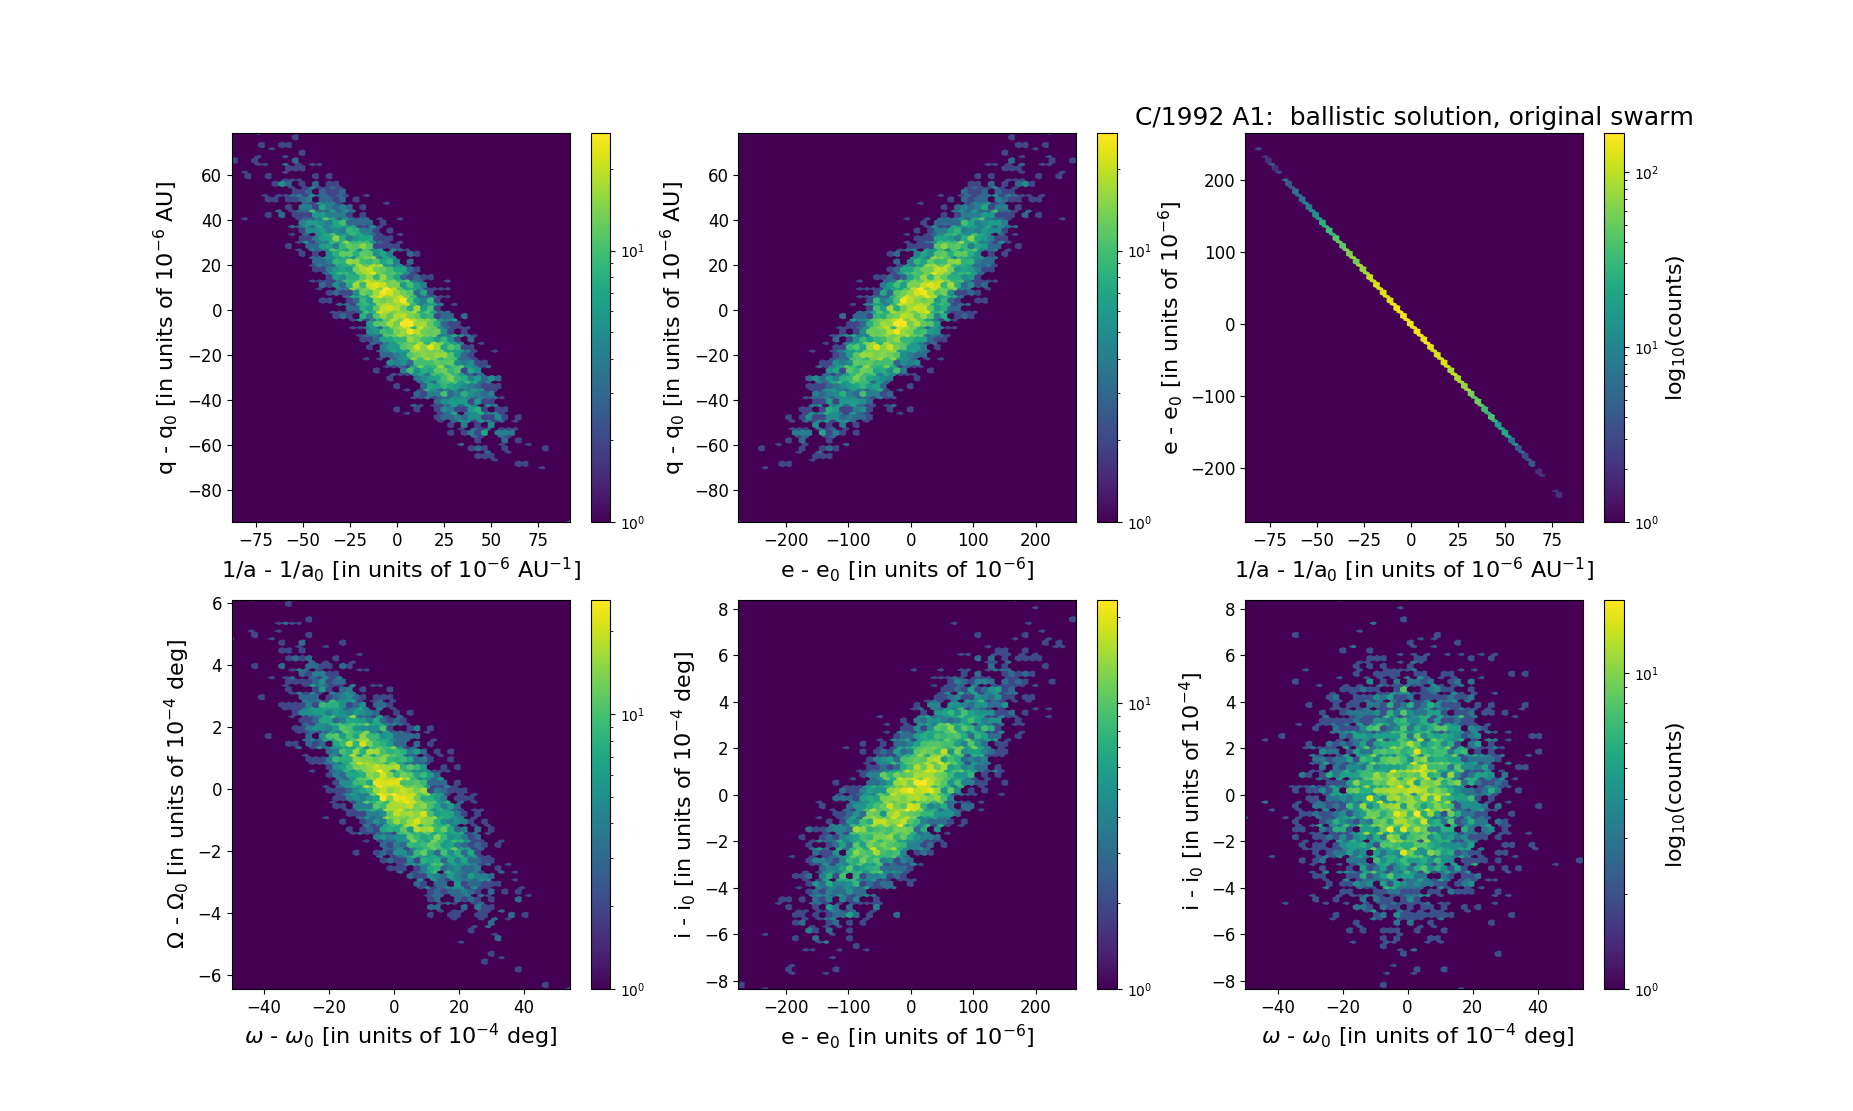
Six 2D-projections of the 6D space of original swarm including 5001 VCs. Each density map is given in logarithmic scale presented on the right in the individual panel.