C/1993 F1 Mueller
more info
Comet C/1993 F1 was discovered by Jean Mueller on a 75-min exposure obtained on 19 March 1993 by J. D. Mendenhall and herself (with the 1.2-m Oschin Schmidt telescope in the course of the second Palomar Sky Survey; see IAUC 5723), when the comet was 7.5 months after its perihelion passage. The comet was last seen on 4 July 1995.
The comet made its close approach to the Earth on 8 February 1993 (5.52 au), that was six weeks before its discovery (six months after perihelion). However, slightly deeper close approach to the Earth was in the previous opposition (not observed) when the comet was within 5.28 au from the Earth (10 January 1992, about seven months before perihelion passage).
Solution given here is based on data spanning over 2.27 yr in a range of heliocentric distances from 6.11 au to 9.30 au.
This Oort spike comet suffers moderate planetary perturbations during its passage through the planetary system that lead to escape of the comet from the solar system (see future barycentric orbit).
See also Królikowska 2014 and Królikowska and Dybczyński 2017.
| solution description | ||
|---|---|---|
| number of observations | 111 | |
| data interval | 1993 03 19 – 1995 07 04 | |
| data type | observed only after perihelion (POST) | |
| data arc selection | entire data set (STD) | |
| range of heliocentric distances | 6.11 au – 9.3au | |
| detectability of NG effects in the comet's motion | NG effects not determinable | |
| type of model of motion | GR - gravitational orbit | |
| data weighting | YES | |
| number of residuals | 219 | |
| RMS [arcseconds] | 1.11 | |
| orbit quality class | 1a | |
| orbital elements (barycentric ecliptic J2000) | ||
|---|---|---|
| Epoch | 1685 03 08 | |
| perihelion date | 1992 08 06.15378600 | ± 0.01051100 |
| perihelion distance [au] | 5.89949798 | ± 0.00006956 |
| eccentricity | 0.99963062 | ± 0.00003712 |
| argument of perihelion [°] | 62.056088 | ± 0.001154 |
| ascending node [°] | 77.524079 | ± 0.000133 |
| inclination [°] | 53.980307 | ± 0.00005 |
| reciprocal semi-major axis [10-6 au-1] | 62.61 | ± 6.29 |
| file containing 5001 VCs swarm |
|---|
| 1993f1a2.bmi |
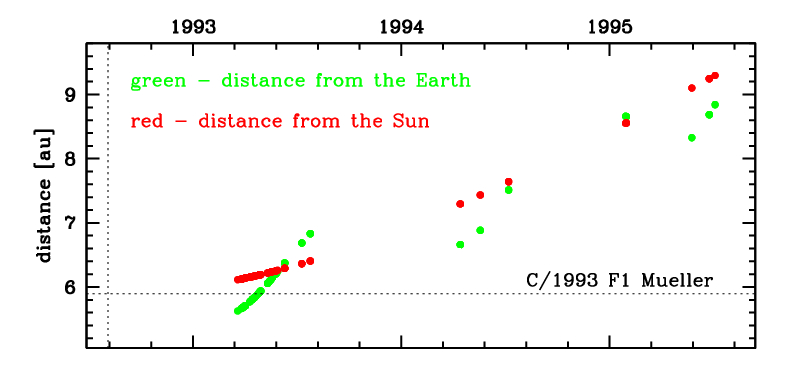
Time distribution of positional observations with corresponding heliocentric (red curve) and geocentric (green curve) distance at which they were taken. The horizontal dotted line shows the perihelion distance for a given comet whereas vertical dotted line — the moment of perihelion passage.
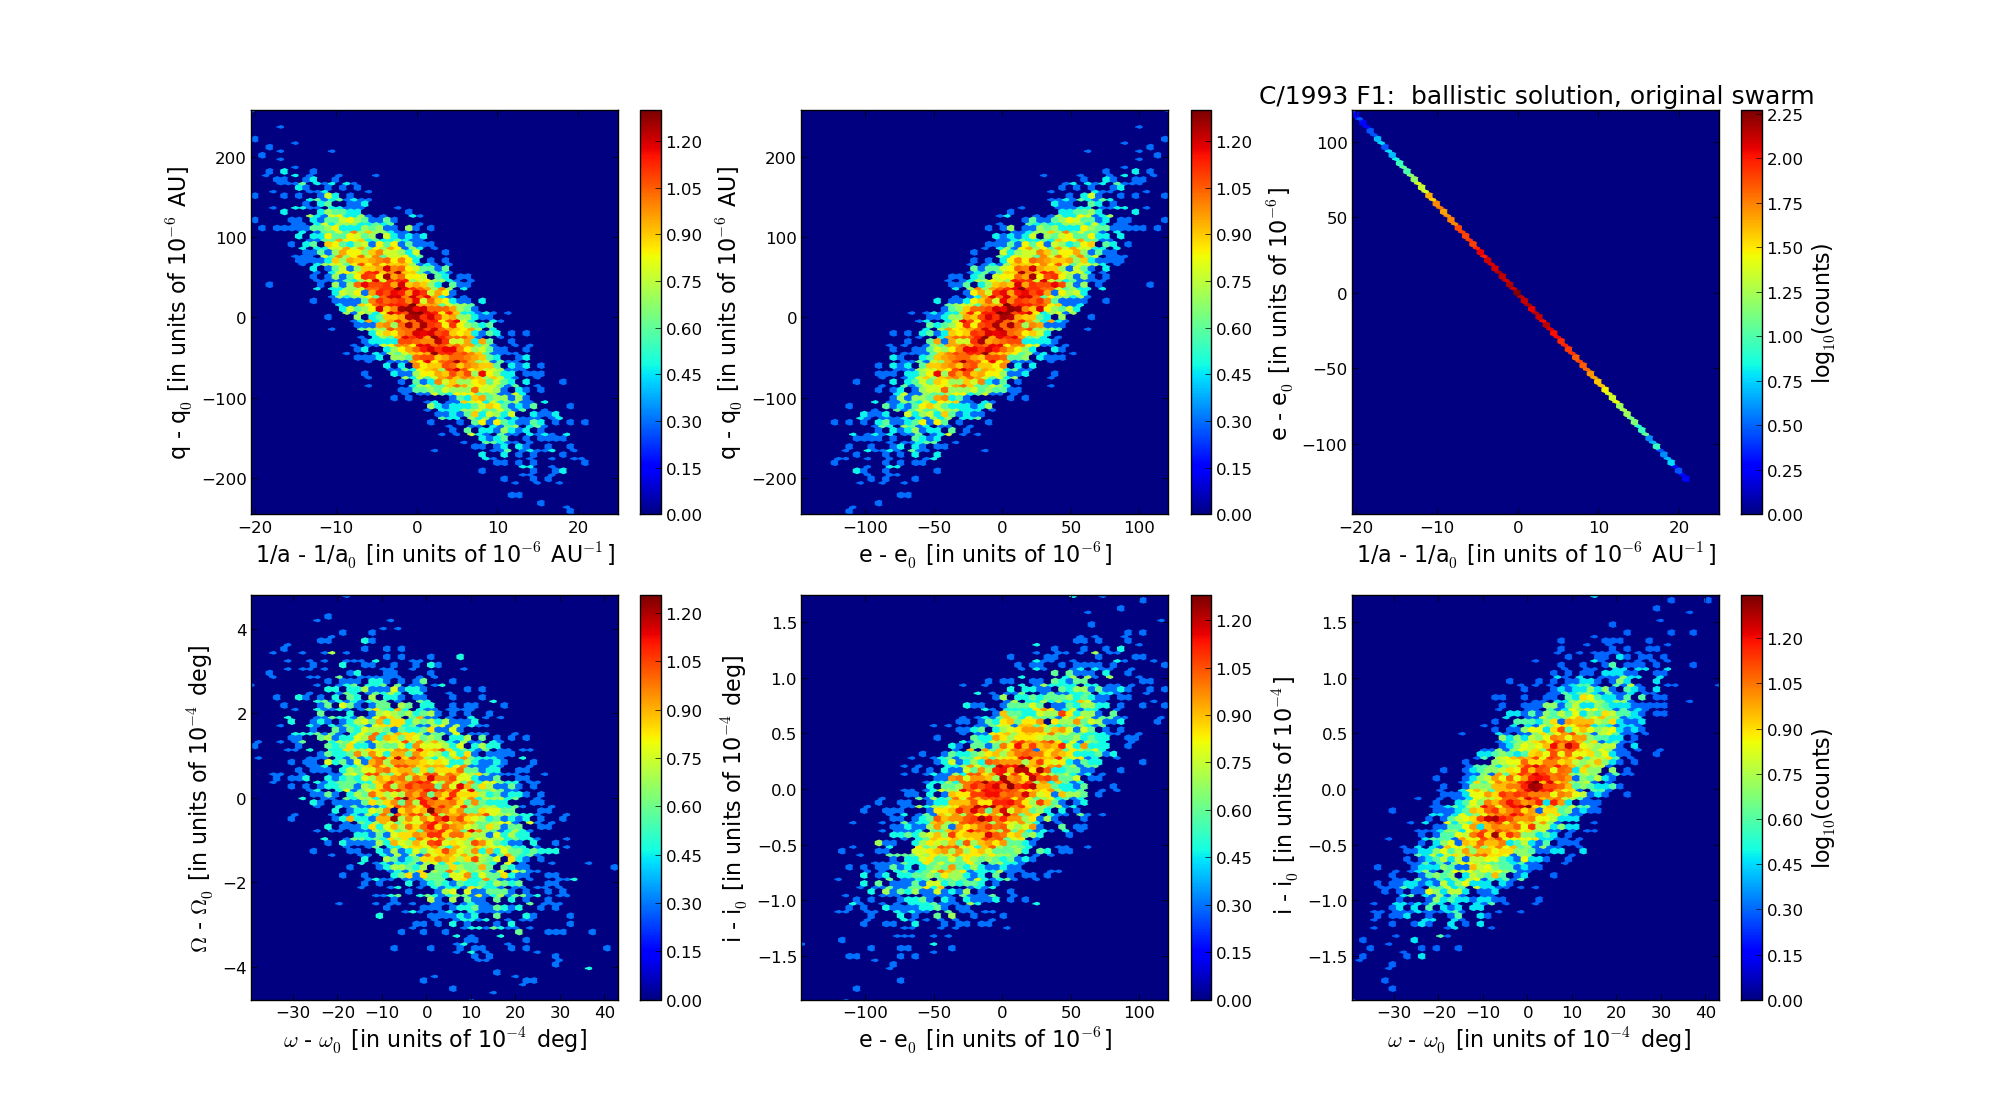
Six 2D-projections of the 6D space of original swarm including 5001 VCs. Each density map is given in logarithmic scale presented on the right in the individual panel.