C/1993 Q1 Mueller
more info
Comet C/1993 Q1 was discovered on 16 August 1993 by Jean Mueller (Palomar Sky Survey II). Later, a prediscovery image of this comet taken on 28 September 1992 (Palomar Mountain-DSS) was found. At the moment of discovery, this comet was about 7.5 months before its perihelion passage and it was last observed in the mid-April 1994.
Comet had its closest approach to the Earth on 7 May 1994 (0.899 au), 1.5 month after its perihelion passage.
Preferred solution given here is based on data spanning over 1.55 yr in a range of heliocentric distances: 6.51 au – 0.967 au (perihelion) – 1.04 au.
Sekanina (2019) speculates that this comet may not have survived the perihelion passage.
This Oort spike comet suffers small planetary perturbations during its passage through the planetary system; if C/1993 Q1 survived the perihelion passage these perturbations lead to escape the comet on hyperbolic orbit from the planetary zone.
See also Królikowska 2020. .
| solution description | ||
|---|---|---|
| number of observations | 536 | |
| data interval | 1992 09 28 – 1994 04 17 | |
| data type | almost all measurements before perihelion (PRE++) | |
| data arc selection | entire data set (STD) | |
| range of heliocentric distances | 6.51 au – 0.97 au (perihelion) – 1.04 au | |
| type of model of motion | NS - non-gravitational orbits for standard g(r) | |
| data weighting | YES | |
| number of residuals | 1063 | |
| RMS [arcseconds] | 0.93 | |
| orbit quality class | 1b | |
| orbital elements (barycentric ecliptic J2000) | ||
|---|---|---|
| Epoch | 2290 02 25 | |
| perihelion date | 1994 03 26.87821357 | ± 0.00047755 |
| perihelion distance [au] | 0.96276011 | ± 0.00001035 |
| eccentricity | 1.00018877 | ± 0.00002085 |
| argument of perihelion [°] | 260.876283 | ± 0.001160 |
| ascending node [°] | 193.679190 | ± 0.000432 |
| inclination [°] | 104.96954 | ± 0.000146 |
| reciprocal semi-major axis [10-6 au-1] | -196.07 | ± 21.65 |
| file containing 5001 VCs swarm |
|---|
| 1993q1n5.bpl |
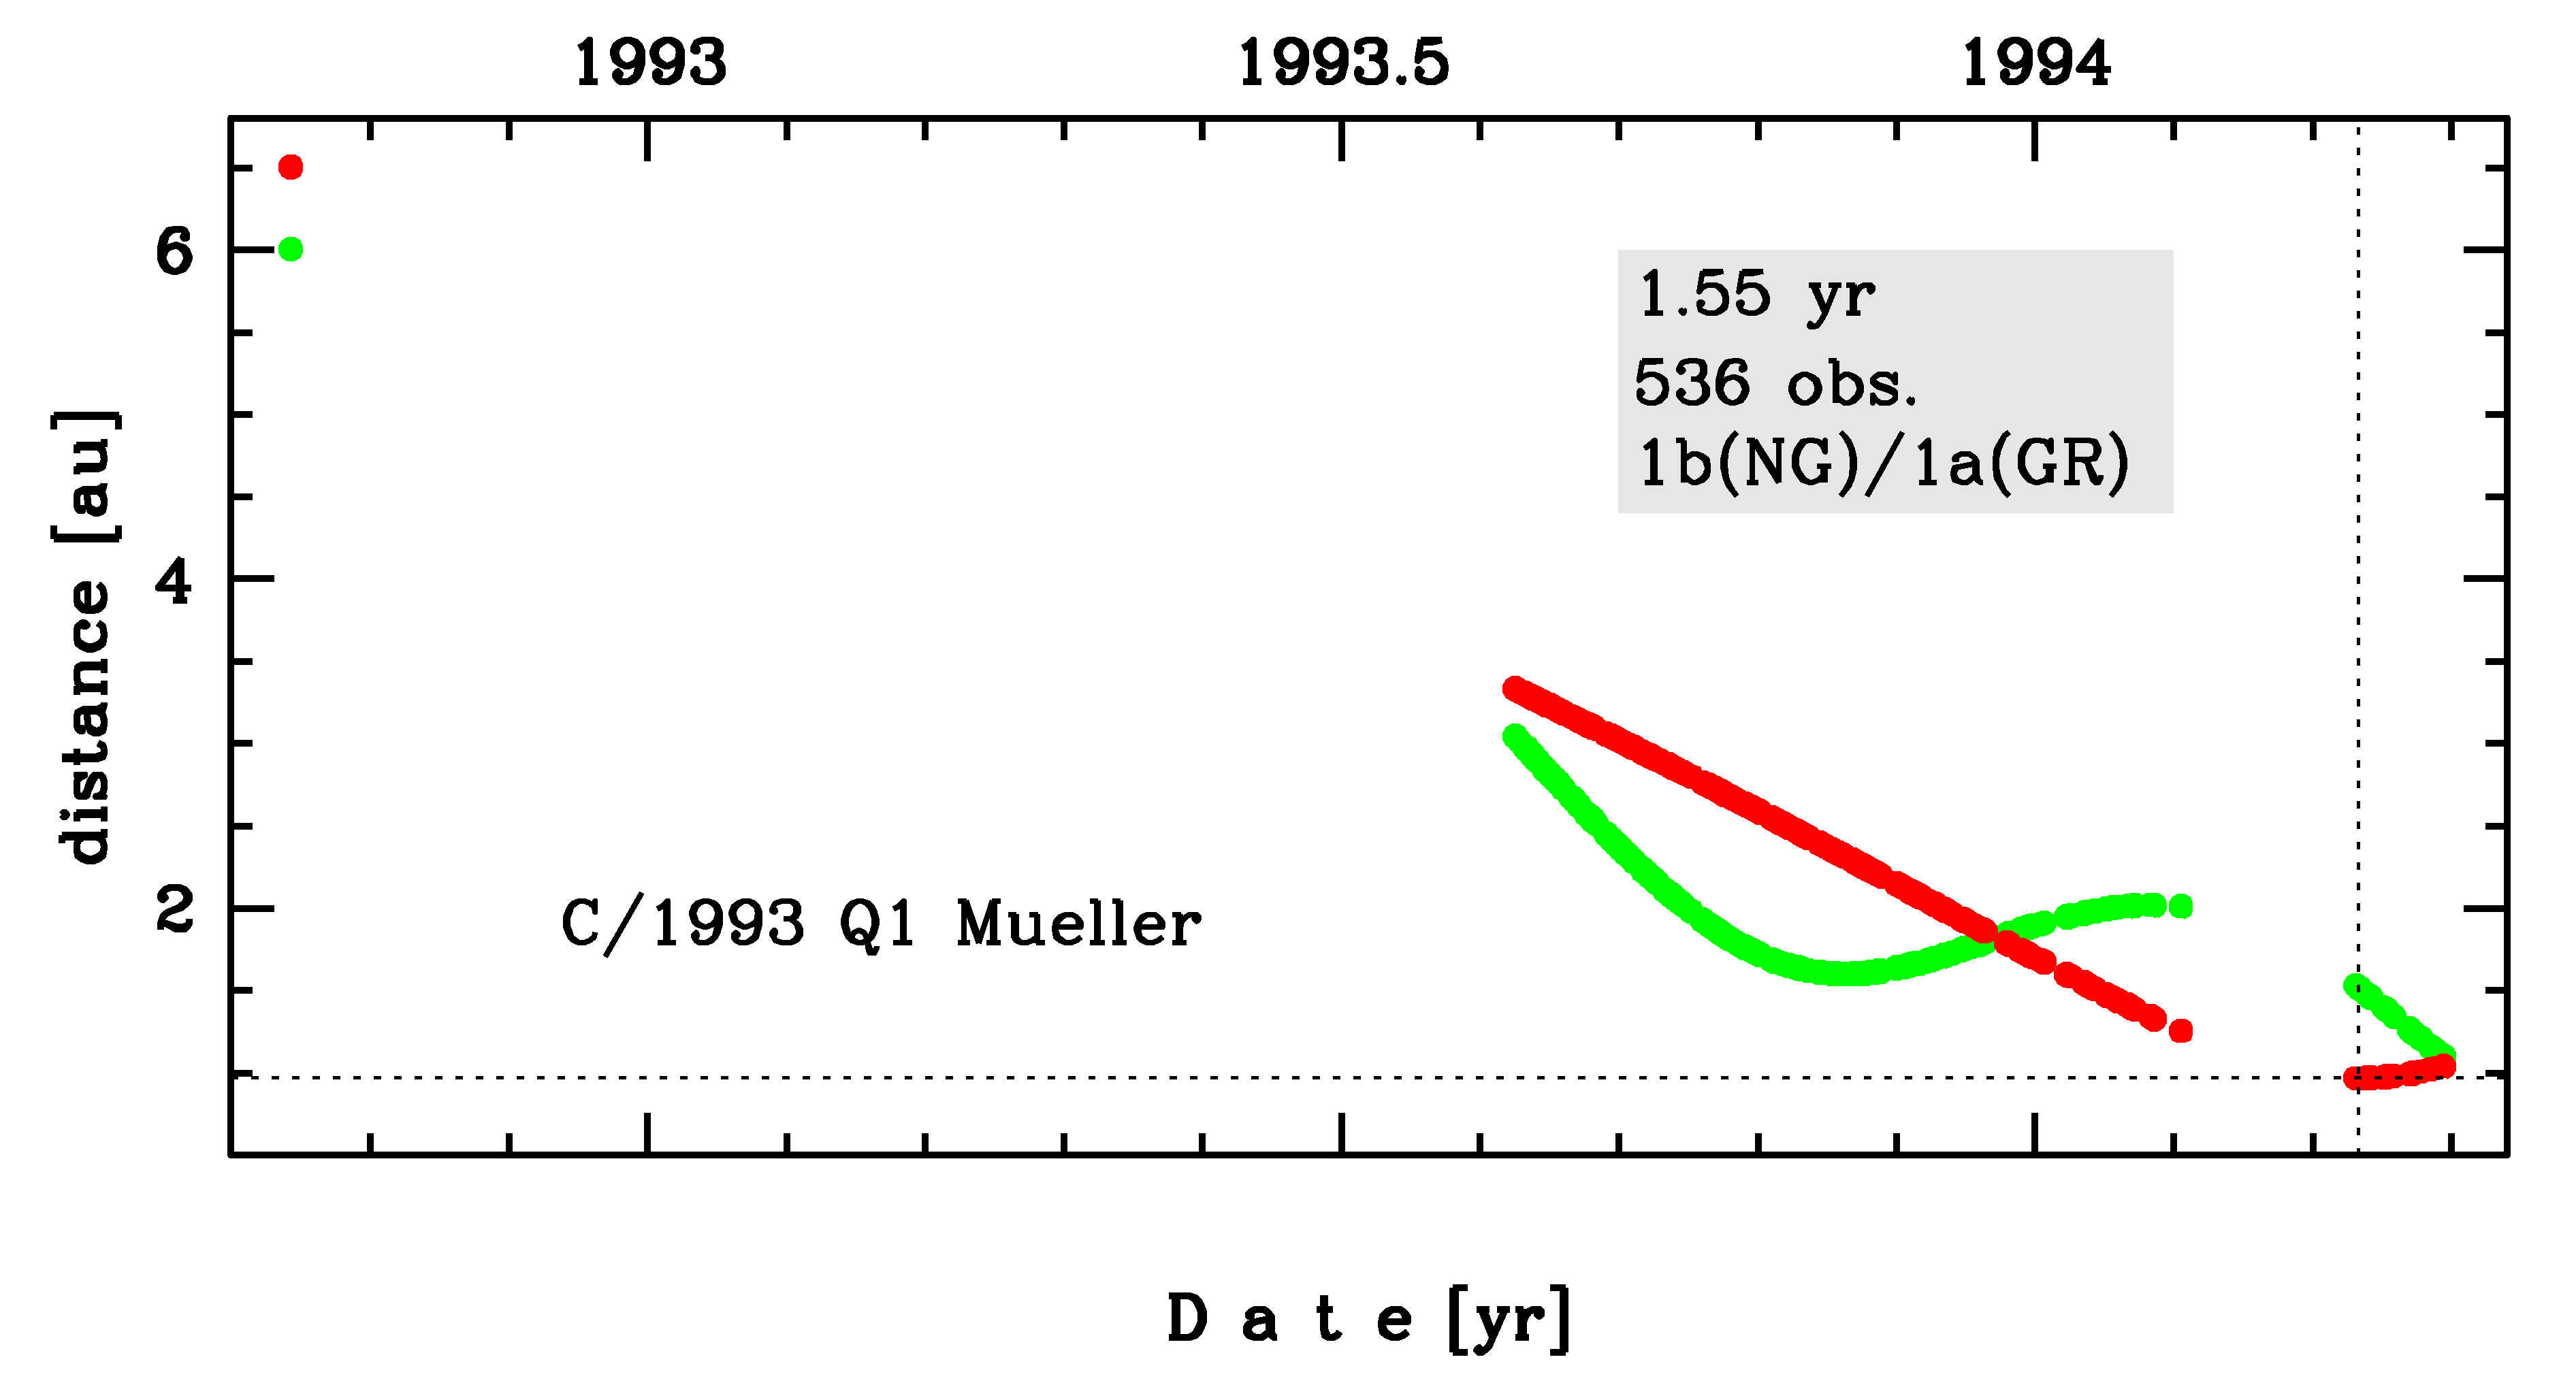
Time distribution of positional observations with corresponding heliocentric (red curve) and geocentric (green curve) distance at which they were taken. The horizontal dotted line shows the perihelion distance for a given comet whereas vertical dotted line — the moment of perihelion passage.
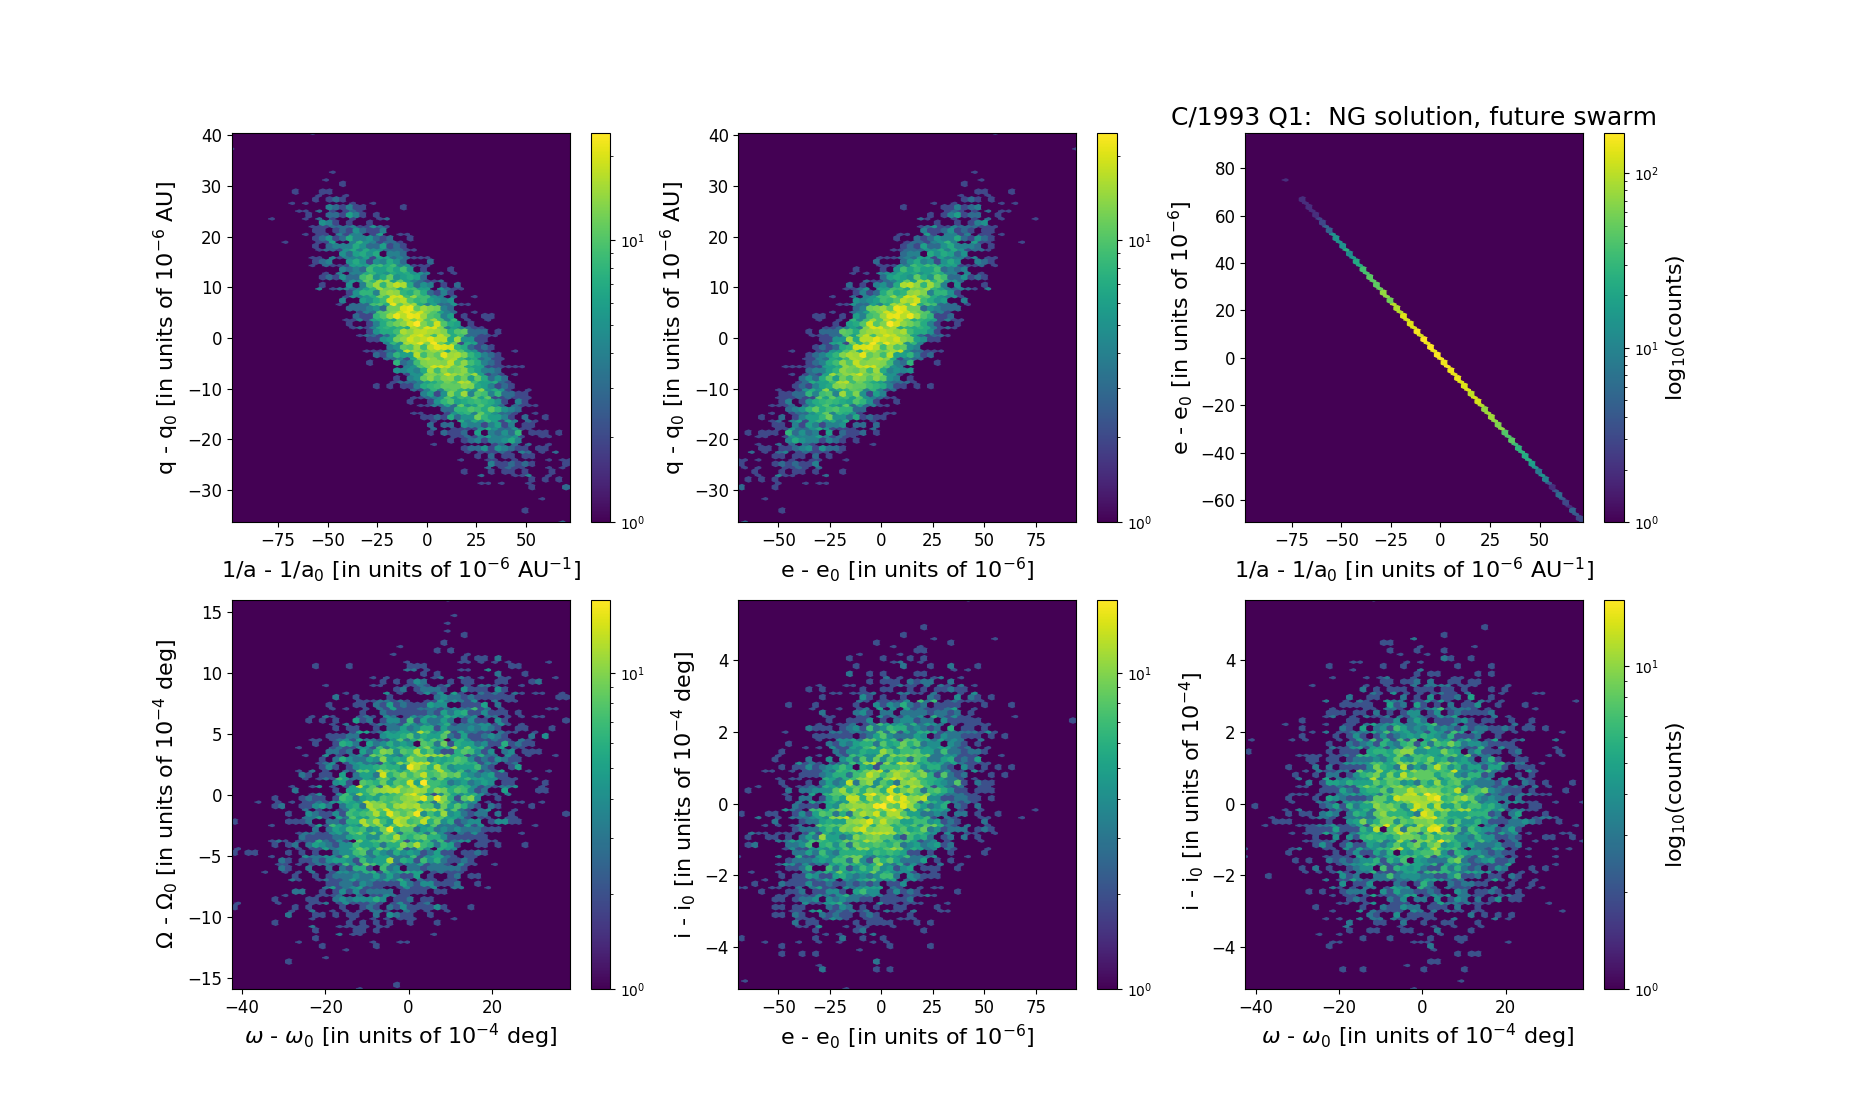
Six 2D-projections of the 6D space of future swarm including 5001 VCs. Each density map is given in logarithmic scale presented on the right in the individual panel.