C/1995 Y1 Hyakutake
more info
Comet C/1995 Y1 was discovered on 25 December 1995 by Yuji Hyakutake (Japan), that is 2 months before its perihelion passage. This comet was last observed in the second half of September 1996.
Comet had its closest approach to the Earth on 15 February 1996 (1.237 au), 9 days before its perihelion passage.
Solutions given here are based on data spanning over 0.736 yr in a range of heliocentric distances: 1.43 au – 1.057 au (perihelion) – 3.16 au.It is difficult to indicate the preferred orbit and here the non-gravitational orbit giving the smallest RMS is taken as preferred.
This Oort spike comet suffers rather large planetary perturbations during its passage through the planetary system; these perturbations lead to a more tight future orbit with semimajor axis of about 1,700 au.See also Królikowska 2020.
| solution description | ||
|---|---|---|
| number of observations | 268 | |
| data interval | 1995 12 26 – 1996 09 21 | |
| data type | perihelion within the observation arc (FULL) | |
| data arc selection | entire data set (STD) | |
| range of heliocentric distances | 1.43 au – 1.36 au (perihelion) – 3.16 au | |
| type of model of motion | NS - non-gravitational orbits for standard g(r) | |
| data weighting | YES | |
| number of residuals | 524 | |
| RMS [arcseconds] | 0.68 | |
| orbit quality class | 1b | |
| orbital elements (barycentric ecliptic J2000) | ||
|---|---|---|
| Epoch | 1698 06 08 | |
| perihelion date | 1996 02 24.71313782 | ± 0.00025134 |
| perihelion distance [au] | 1.05688853 | ± 0.00000428 |
| eccentricity | 1.00005154 | ± 0.00000956 |
| argument of perihelion [°] | 46.377719 | ± 0.000389 |
| ascending node [°] | 195.637433 | ± 0.000071 |
| inclination [°] | 54.433695 | ± 0.000044 |
| reciprocal semi-major axis [10-6 au-1] | -48.77 | ± 9.04 |
| file containing 5001 VCs swarm |
|---|
| 1995y1n5.bmi |
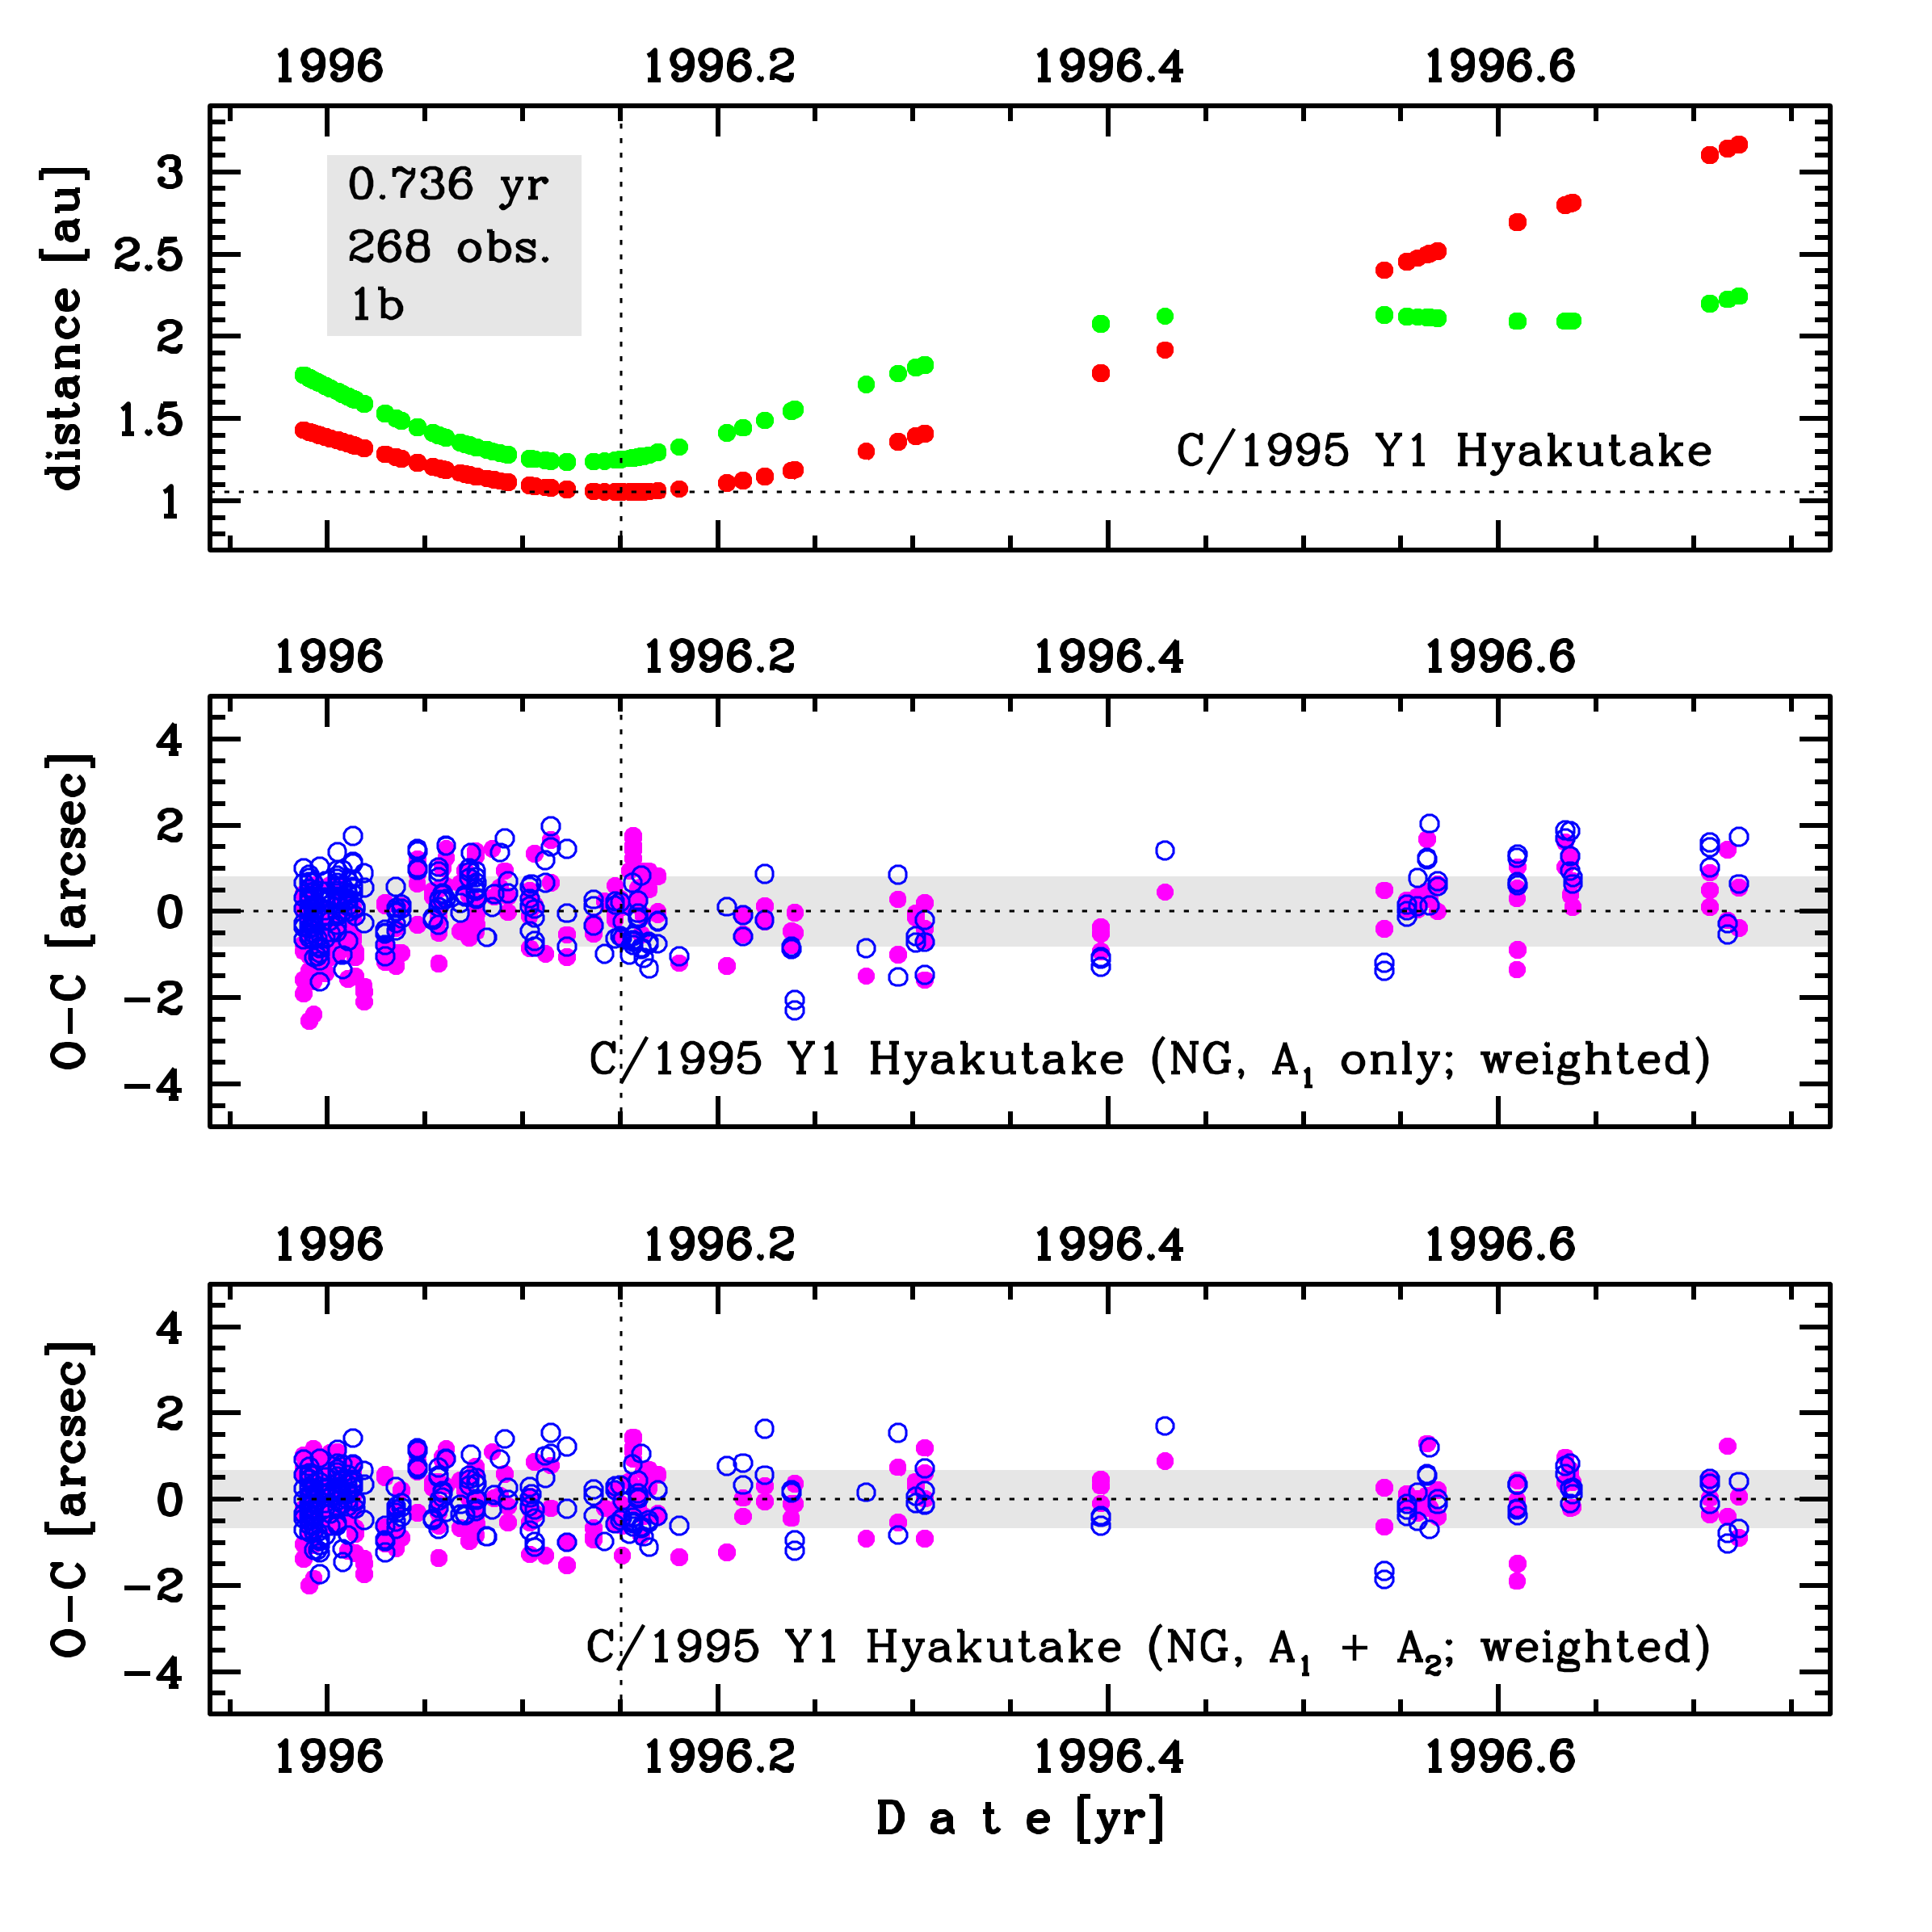
Upper panel: Time distribution of positional observations with corresponding heliocentric (red curve) and geocentric (green curve) distance at which they were taken. The horizontal dotted line shows the perihelion distance for a given comet whereas vertical dotted line — the moment of perihelion passage.
Lower panel (panels): O-C diagram for this(two) solution (solutions) given in this database, where residuals in right ascension are shown using magenta dots and in declination by blue open circles.
Lower panel (panels): O-C diagram for this(two) solution (solutions) given in this database, where residuals in right ascension are shown using magenta dots and in declination by blue open circles.
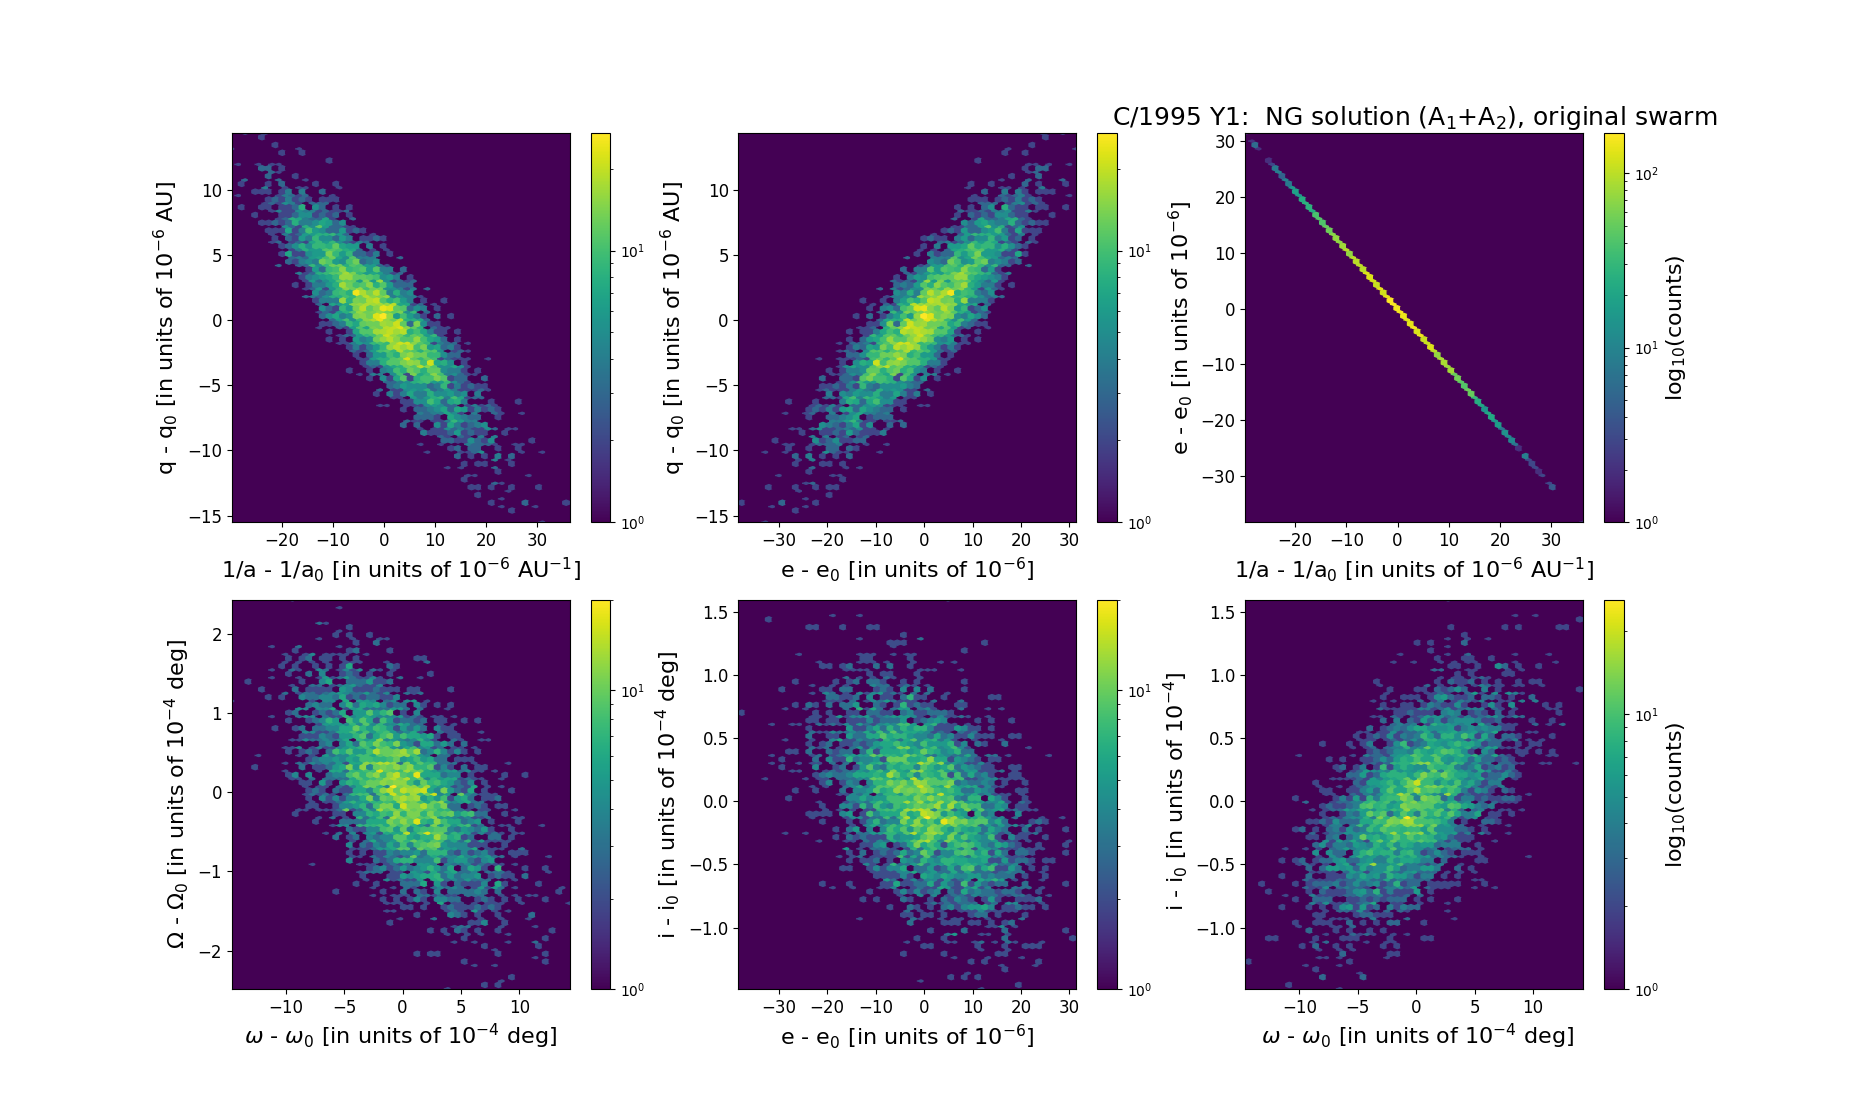
Six 2D-projections of the 6D space of original swarm including 5001 VCs. Each density map is given in logarithmic scale presented on the right in the individual panel.