C/1996 E1 NEAT
more info
Comet C/1996 E1 was discovered on 15 March 1996 by Near-Earth-Asteroid Tracking Team (Jet Propulsion Laboratory), that is about 4.5 months before its perihelion passage.This comet was last observed in the mid-October 1996.
Comet had its closest approach to the Earth on 25 September 1996 (1.168 au), about 2 months after its perihelion passage.
This is a comet with nongravitational effects strongly manifested in positional data fitting.
Solutions given here are based on data spanning over 0.578 yr in a range of heliocentric distances: 2.31 au – 1.36 au (perihelion) – 1.76 au.
This Oort spike comet suffers rather moderate planetary perturbations during its passage through the planetary system; these perturbations lead to a more tight future orbit.
See also Królikowska 2014 and Królikowska 2020.
| solution description | ||
|---|---|---|
| number of observations | 249 | |
| data interval | 1996 03 15 – 1996 10 12 | |
| data type | significantly more measurements before perihelion (PRE+) | |
| data arc selection | entire data set (STD) | |
| range of heliocentric distances | 2.31 au – 1.36 au (perihelion) – 1.76 au | |
| detectability of NG effects in the comet's motion | comet with NG effects strongly manifested in positional data fitting | |
| type of model of motion | GR - gravitational orbit | |
| data weighting | YES | |
| number of residuals | 495 | |
| RMS [arcseconds] | 0.93 | |
| orbit quality class | 1b | |
| previous orbit statistics, both Galactic and stellar perturbations were taken into account | ||
|---|---|---|
| no. of returning VCs in the swarm | 0 | |
| no. of escaping VCs in the swarm | 5001 | |
| no. of hyperbolas among escaping VCs in the swarm | 5001 | * |
| previous reciprocal semi-major axis [10-6 au-1] | -39.88 – -35.25 – -30.55 | |
| previous perihelion distance [au] | 1.461 – 1.473 – 1.524 | |
| synchronous stop epoch [Myr] | -1.96 | S |
| percentage of VCs with qprev < 10 | 100 | |
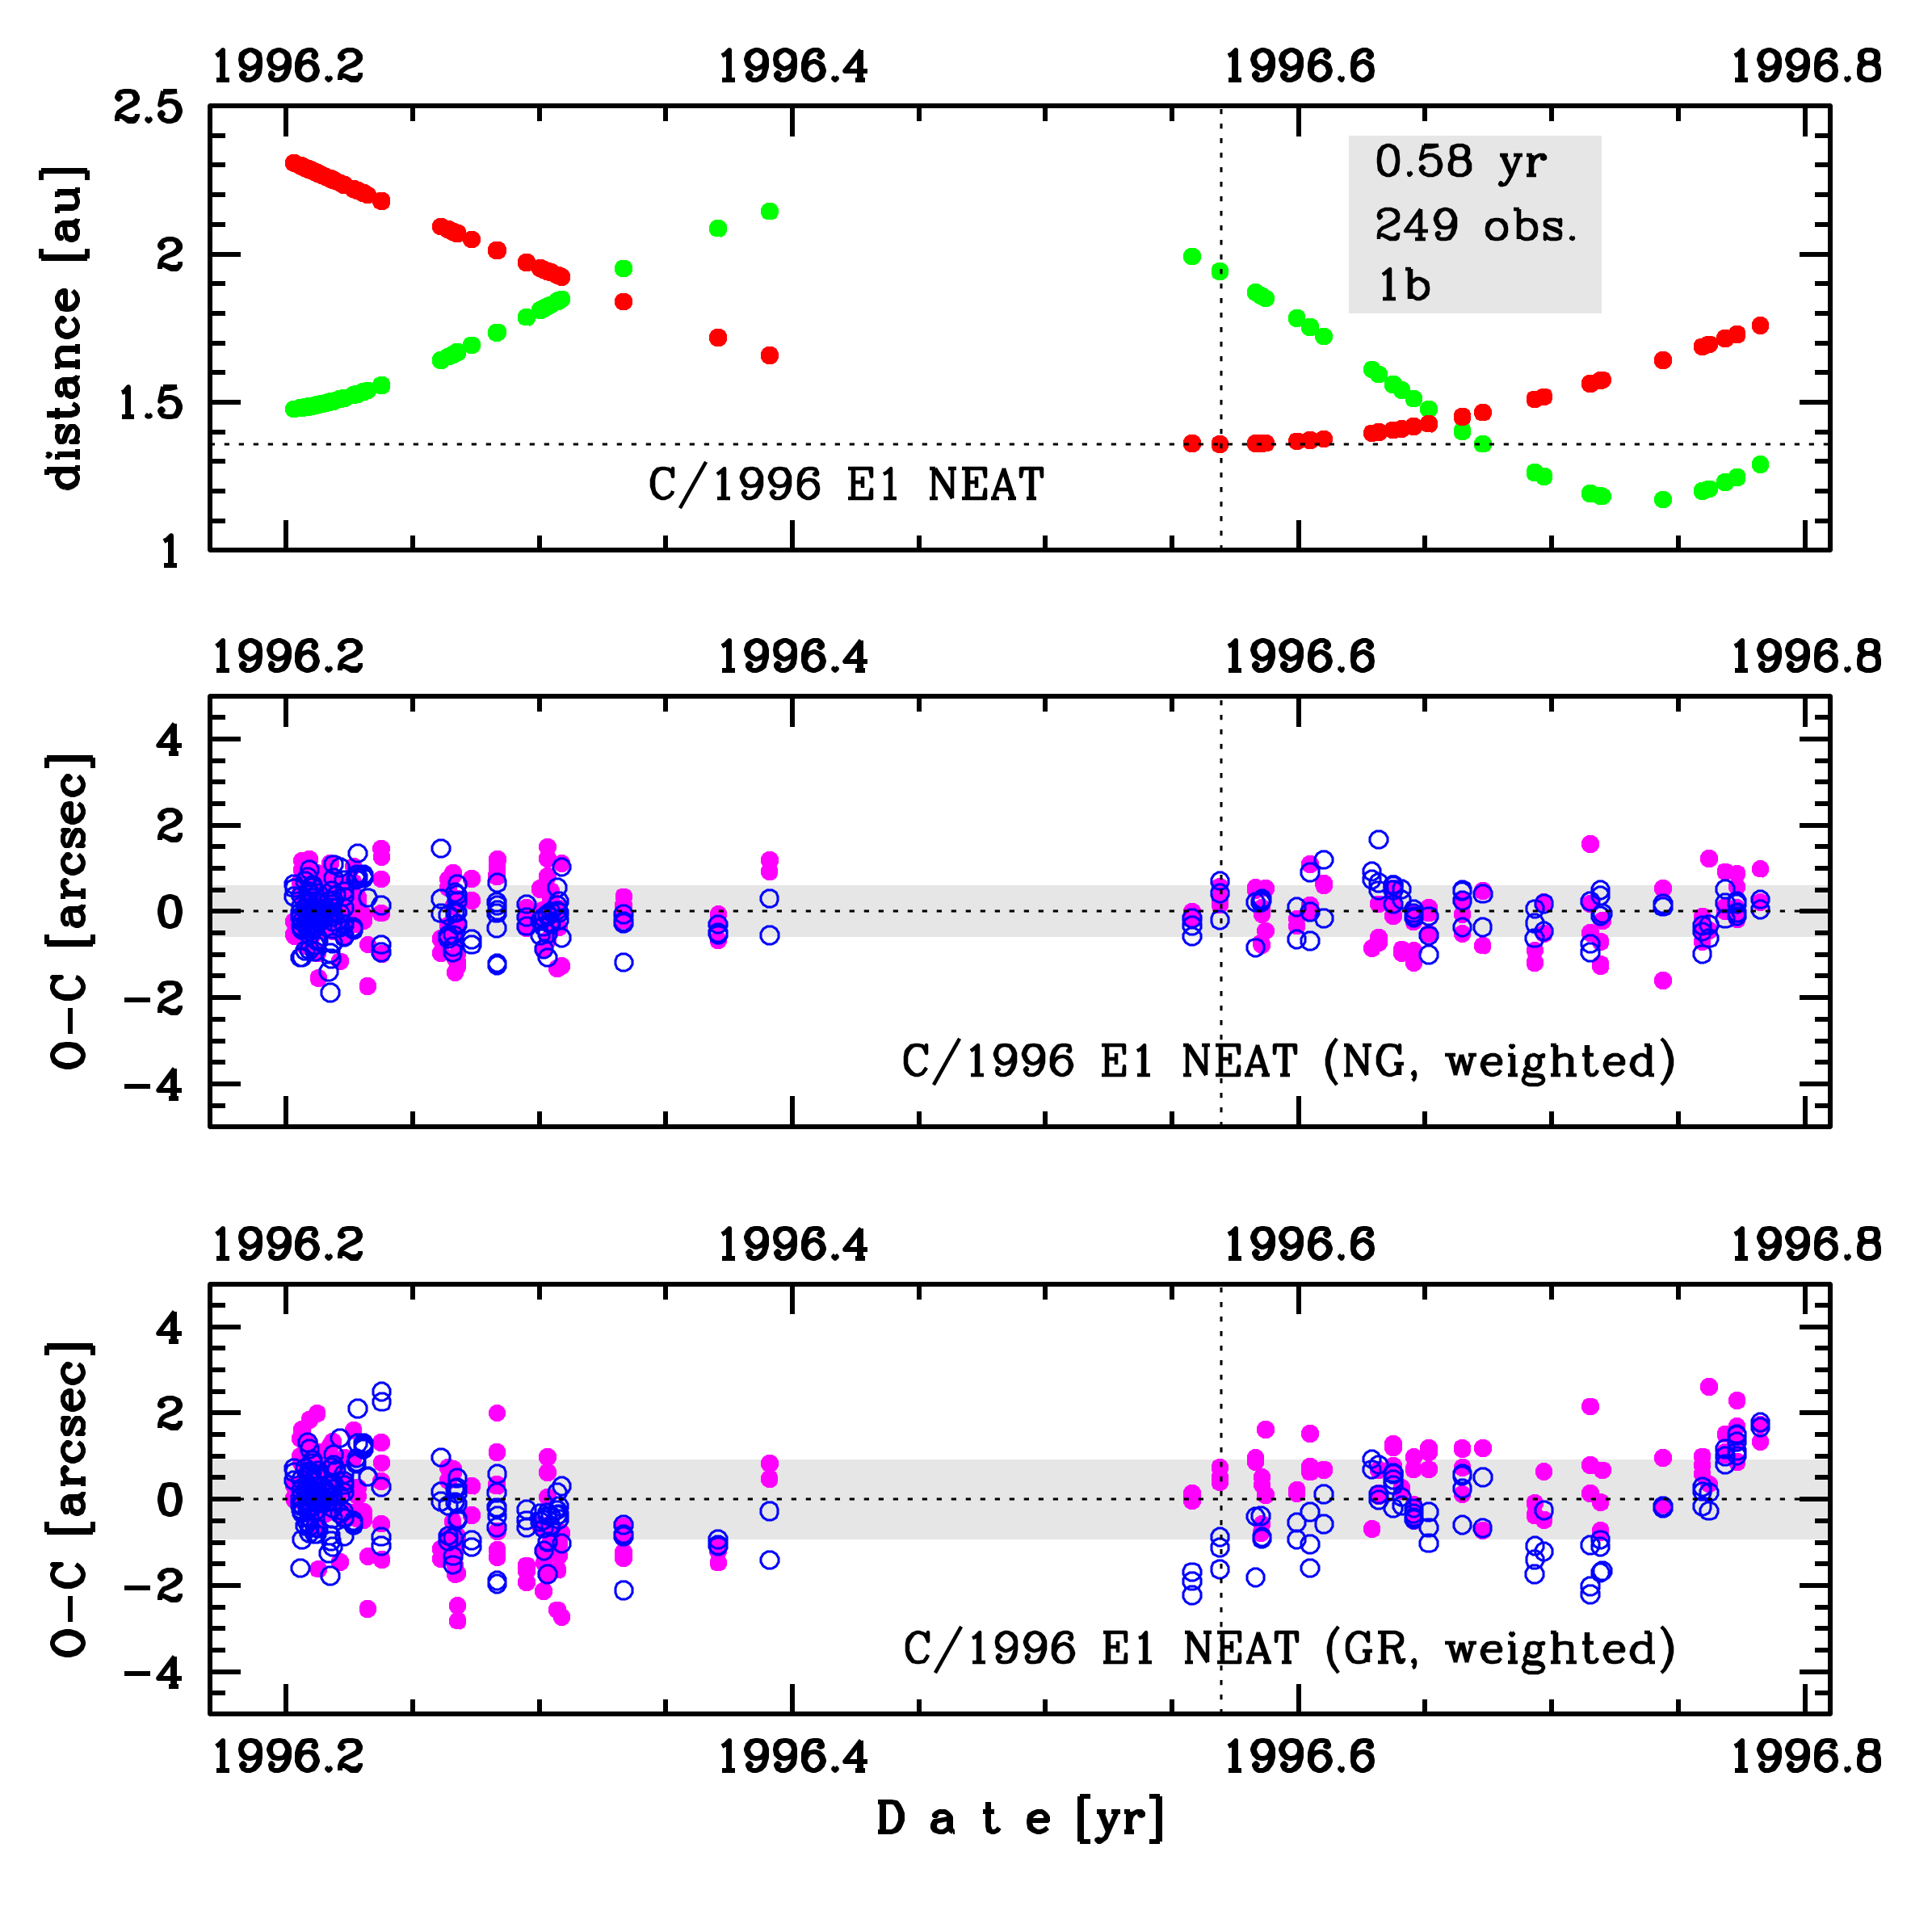
Upper panel: Time distribution of positional observations with corresponding heliocentric (red curve) and geocentric (green curve) distance at which they were taken. The horizontal dotted line shows the perihelion distance for a given comet whereas vertical dotted line — the moment of perihelion passage.
Lower panel (panels): O-C diagram for this(two) solution (solutions) given in this database, where residuals in right ascension are shown using magenta dots and in declination by blue open circles.
Lower panel (panels): O-C diagram for this(two) solution (solutions) given in this database, where residuals in right ascension are shown using magenta dots and in declination by blue open circles.
| previous_g orbit statistics, here only the Galactic tide has been included | ||
|---|---|---|
| no. of returning VCs in the swarm | 0 | |
| no. of escaping VCs in the swarm | 5001 | |
| no. of hyperbolas among escaping VCs in the swarm | 5001 | * |
| previous reciprocal semi-major axis [10-6 au-1] | -40.73 – -36.10 – -31.41 | |
| previous perihelion distance [au] | 4.09 – 4.47 – 4.86 | |
| synchronous stop epoch [Myr] | -2.01 | S |
| percentage of VCs with qprev < 10 | 100 | |