C/1999 S4 LINEAR
more info
Comet C/1999 S4 was discovered on 27 September 1999 with Lincoln Laboratory Near-Earth Asteroid Research project, that is 10 months before its perihelion passage. It was observed until 31 July 2000.
It was the first Oort Cloud comet to have been captured by the Hubble Space Telescope during its fragmentation process. Nucleus decay started around 5/6 July 2000 after the comet first brightened because of its violent outburst, and many chunks were then observed along its orbit. Around 20 July, the comet brightened once again and the main component finally started to disintegrate three days later.
Therefore, preffered solution given here is based on pre-perihelion data spanning over 0.770 yr in a range of heliocentric distances from 4.33 au to 0.861 au (5 July 2000).
Comet had its closest approach to the Earth on 22 July 2000 (0.372 au), 4 days before perihelion passage.
This was Oort spike comet.
See also Sekanina 2019 and Królikowska 2020
| solution description | ||
|---|---|---|
| number of observations | 1116 | |
| data interval | 1999 09 27 – 2000 07 05 | |
| data arc selection | data generally limited to pre-perihelion (PRE) | |
| range of heliocentric distances | 4.33 au – 0.77au | |
| type of model of motion | NS - non-gravitational orbits for standard g(r) | |
| data weighting | YES | |
| number of residuals | 2221 | |
| RMS [arcseconds] | 0.57 | |
| orbit quality class | 1b | |
| orbital elements (barycentric ecliptic J2000) | ||
|---|---|---|
| Epoch | 1702 10 26 | |
| perihelion date | 2000 07 25.53330471 | ± 0.00056929 |
| perihelion distance [au] | 0.76094686 | ± 0.00000552 |
| eccentricity | 0.99999525 | ± 0.00000127 |
| argument of perihelion [°] | 151.122038 | ± 0.000136 |
| ascending node [°] | 83.186798 | ± 0.000080 |
| inclination [°] | 149.275747 | ± 0.000083 |
| reciprocal semi-major axis [10-6 au-1] | 6.24 | ± 1.67 |
| file containing 5001 VCs swarm |
|---|
| 1999s4n7.bmi |
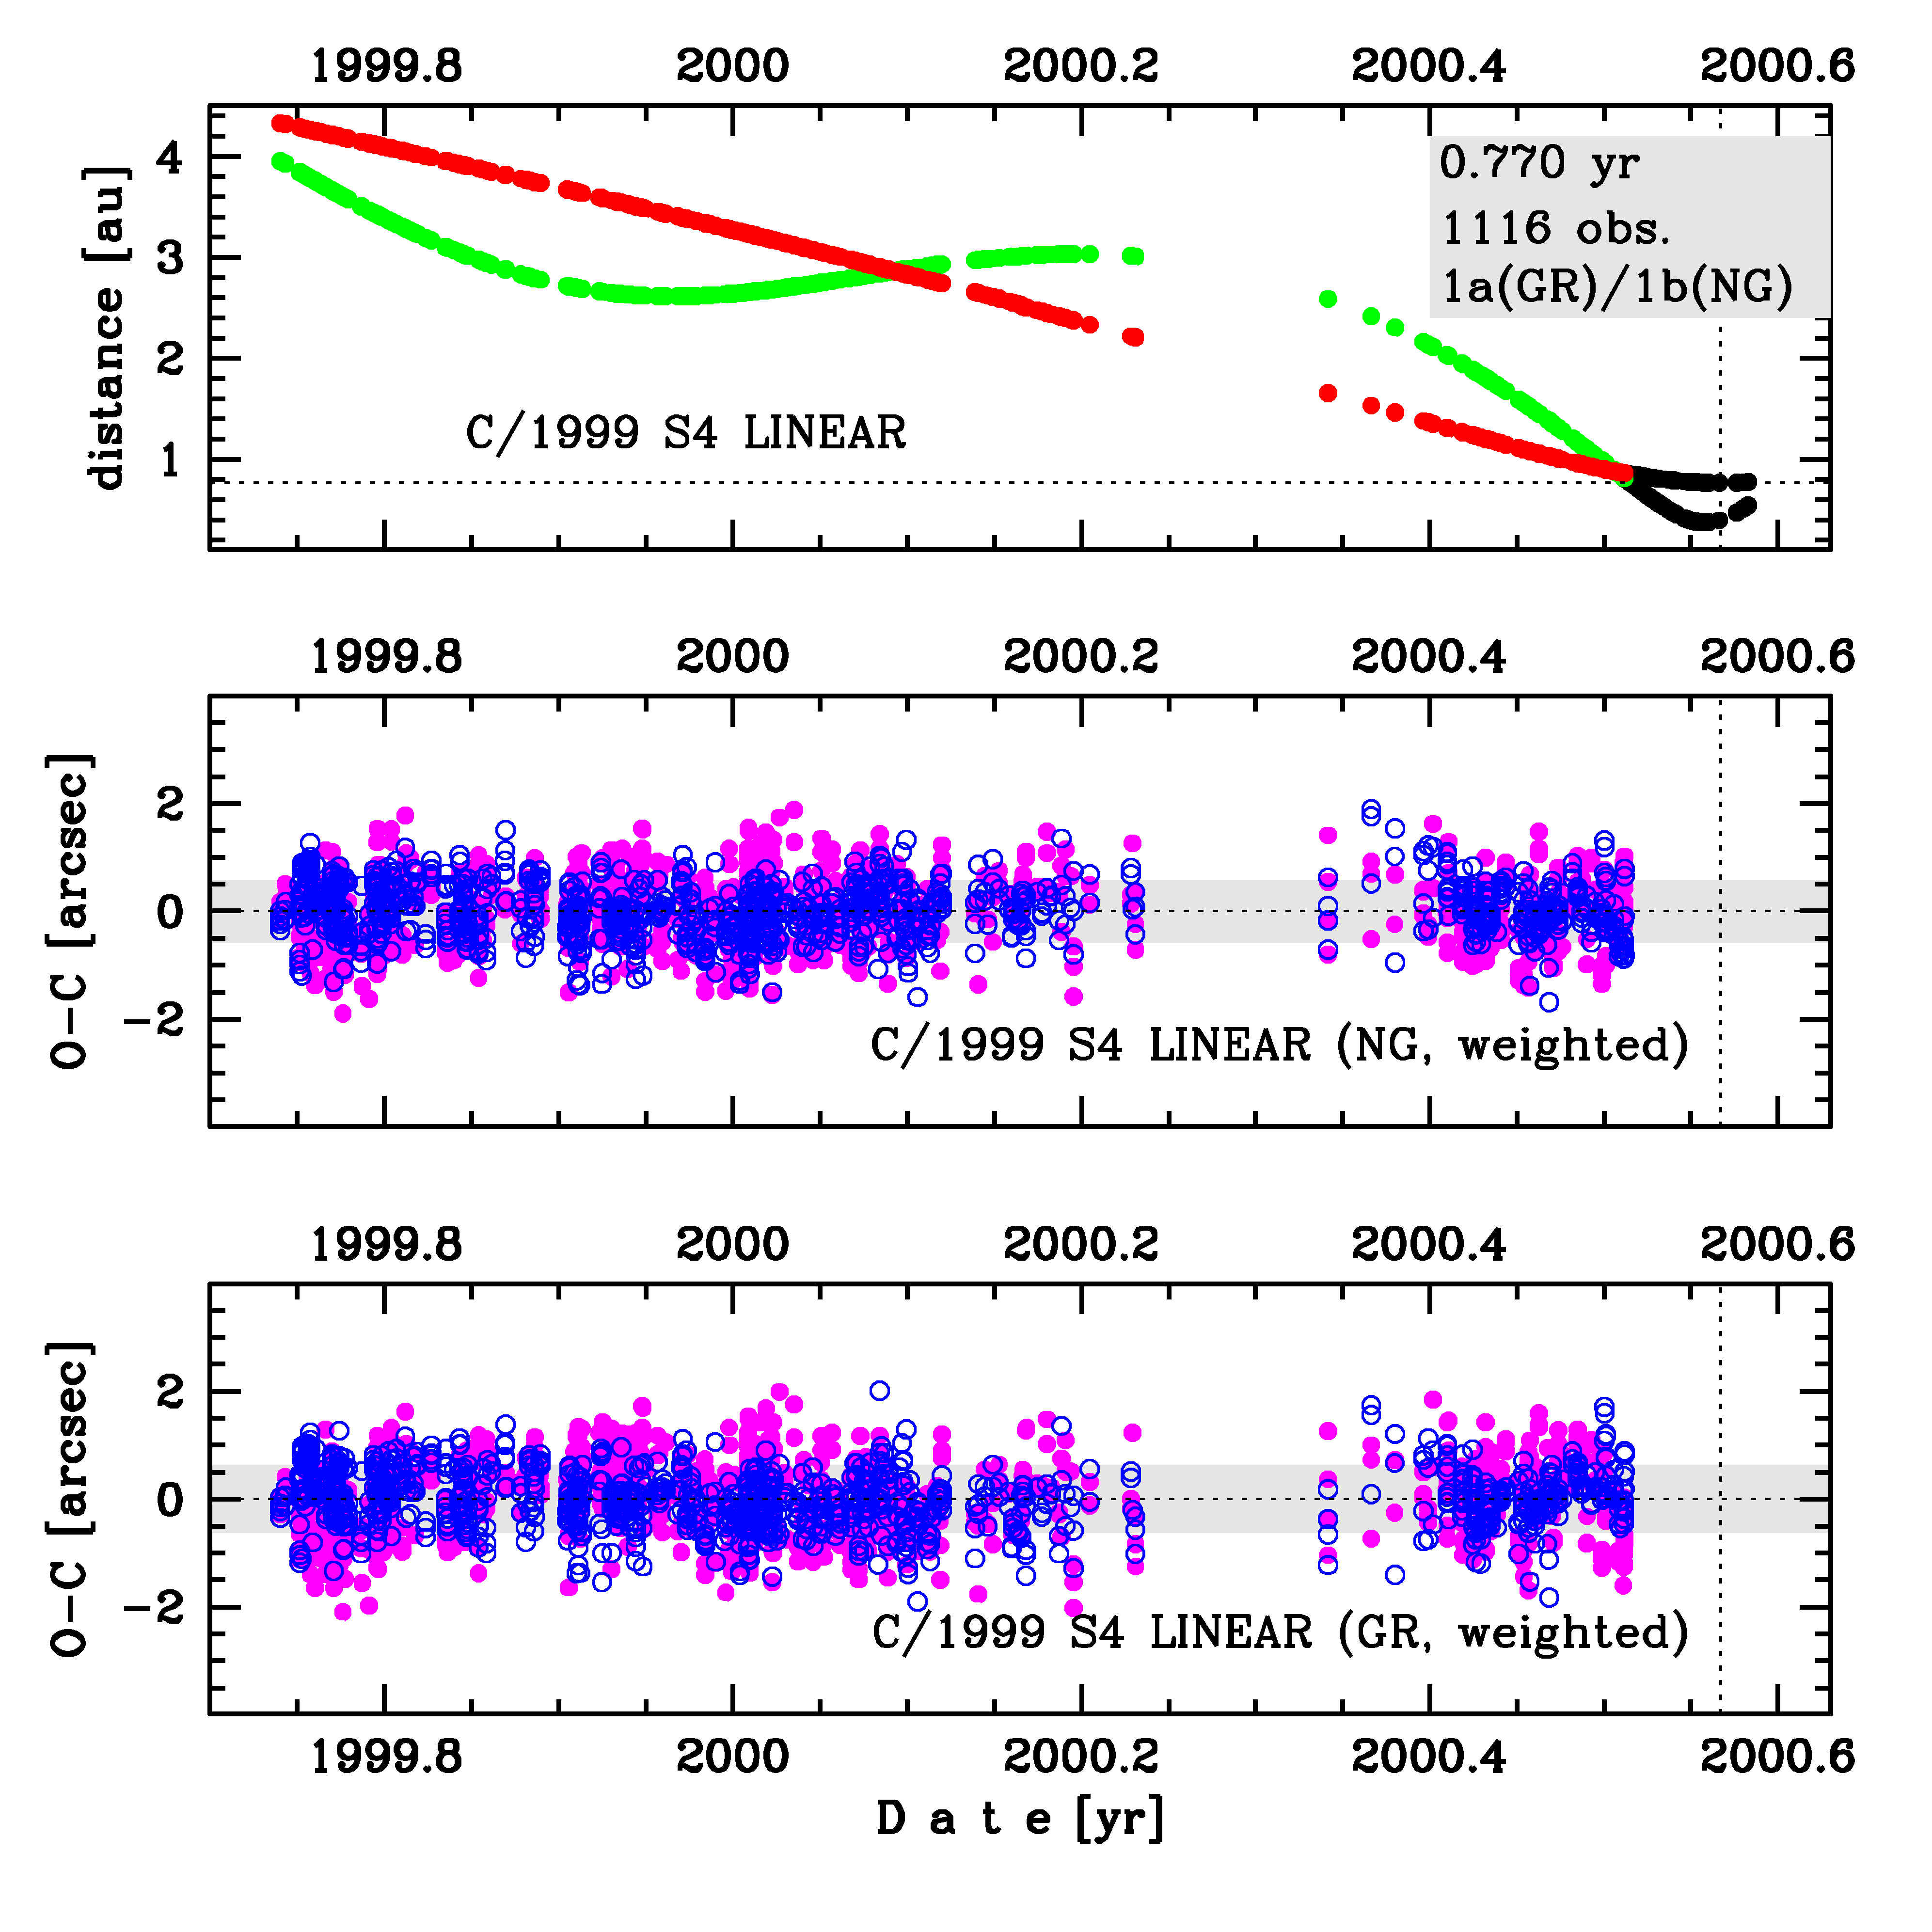
Upper panel: Time distribution of positional observations with corresponding heliocentric (red curve) and geocentric (green curve) distance at which they were taken. The horizontal dotted line shows the perihelion distance for a given comet whereas vertical dotted line — the moment of perihelion passage.
Lower panel (panels): O-C diagram for this(two) solution (solutions) given in this database, where residuals in right ascension are shown using magenta dots and in declination by blue open circles.
Lower panel (panels): O-C diagram for this(two) solution (solutions) given in this database, where residuals in right ascension are shown using magenta dots and in declination by blue open circles.
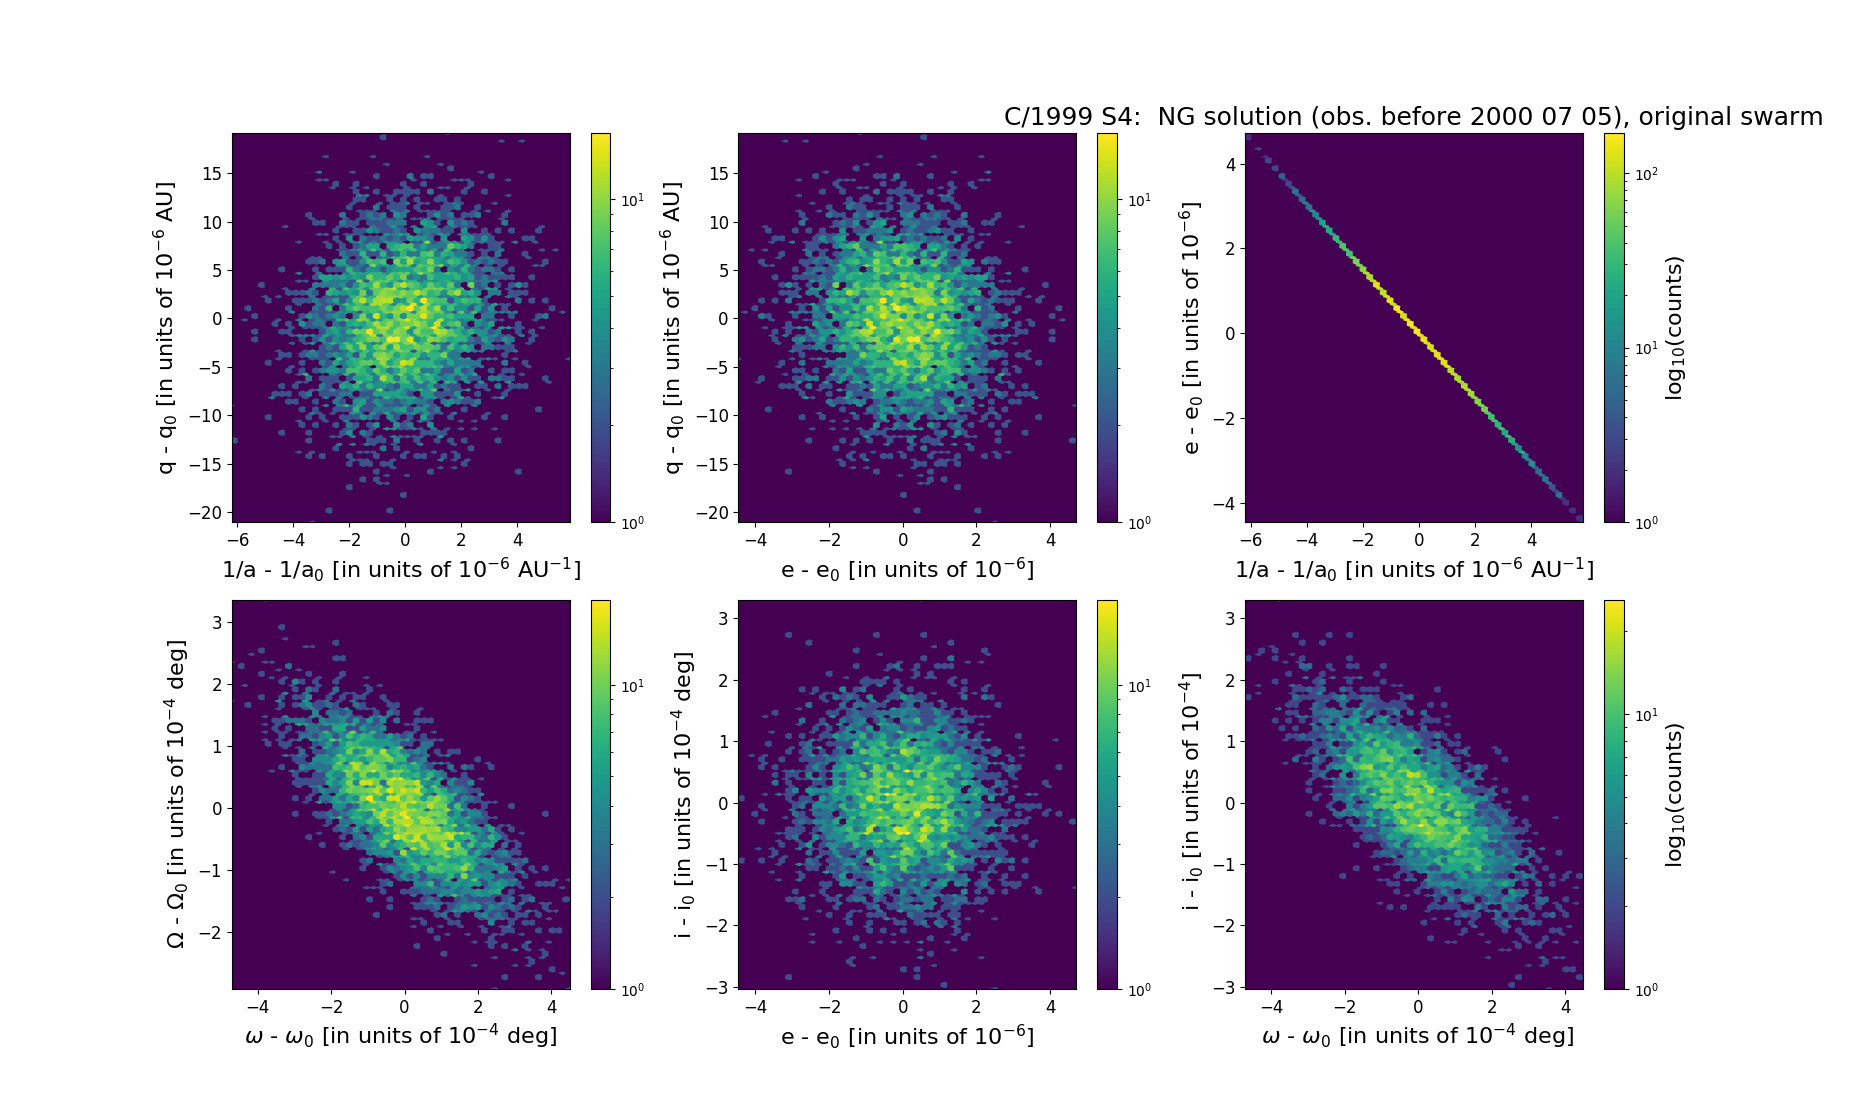
Six 2D-projections of the 6D space of original swarm including 5001 VCs. Each density map is given in logarithmic scale presented on the right in the individual panel.