C/1999 U1 Ferris
more info
C/1999 U1 was discovered on 18 October 1999 by W.D. Ferris of LONEOS team [IAUC 7283, 1999 October 18]. Later, pre-discovery measurements taken by Siding Spring on 22 December 1998 were found.
This comet made its closest approach to the Earth on 11 December 1998 (3.667 au), 3.3 months after perihelion.
Solution given here is based on data spanning over 1.1 yr in a range of heliocentric distances from 4.24 au to 5.89 au.
This Oort spike comet suffers rather strong planetary perturbations during its passage through the planetary system that lead to notable more tight future orbit with semimajor axis shorter than 2000 au (see future barycentric orbit).
See also Królikowska 2014 and Królikowska and Dybczyński 2017.
| solution description | ||
|---|---|---|
| number of observations | 208 | |
| data interval | 1998 12 22 – 2000 01 28 | |
| data type | observed only after perihelion (POST) | |
| data arc selection | entire data set (STD) | |
| range of heliocentric distances | 4.24 au – 5.89au | |
| detectability of NG effects in the comet's motion | NG effects not determinable | |
| type of model of motion | GR - gravitational orbit | |
| data weighting | YES | |
| number of residuals | 410 | |
| RMS [arcseconds] | 0.51 | |
| orbit quality class | 1a | |
| next orbit statistics, both Galactic and stellar perturbations were taken into account | ||
|---|---|---|
| no. of returning VCs in the swarm | 5001 | * |
| no. of escaping VCs in the swarm | 0 | |
| no. of hyperbolas among escaping VCs in the swarm | 0 | |
| next reciprocal semi-major axis [10-6 au-1] | 533.76 – 537.65 – 541.40 | |
| next perihelion distance [au] | 4.12913 – 4.12915 – 4.12918 | |
| next aphelion distance [103 au] | 3.69 – 3.716 – 3.743 | |
| time interval to next perihelion [Myr] | 0.079 – 0.0798 – 0.0807 | |
| percentage of VCs with qnext < 10 | 100 | |
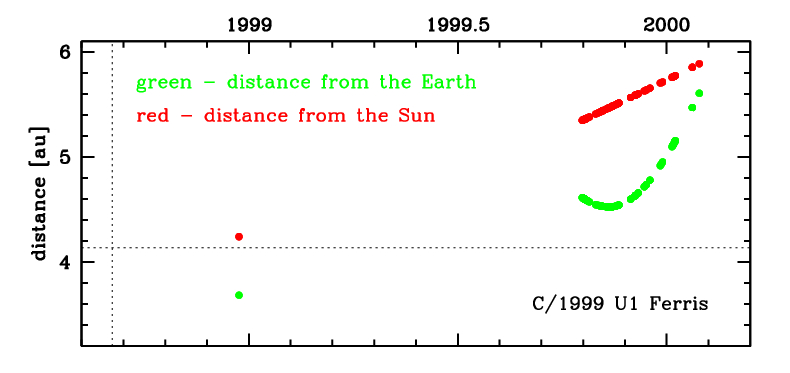
Time distribution of positional observations with corresponding heliocentric (red curve) and geocentric (green curve) distance at which they were taken. The horizontal dotted line shows the perihelion distance for a given comet whereas vertical dotted line — the moment of perihelion passage.
| next_g orbit statistics, here only the Galactic tide has been included | ||
|---|---|---|
| no. of returning VCs in the swarm | 5001 | * |
| no. of escaping VCs in the swarm | 0 | |
| no. of hyperbolas among escaping VCs in the swarm | 0 | |
| next reciprocal semi-major axis [10-6 au-1] | 533.76 – 537.65 – 541.40 | |
| next perihelion distance [au] | 4.12987 – 4.1299 – 4.12993 | |
| next aphelion distance [103 au] | 3.69 – 3.716 – 3.743 | |
| time interval to next perihelion [Myr] | 0.079 – 0.0798 – 0.0808 | |
| percentage of VCs with qnext < 10 | 100 | |