C/1999 Y1 LINEAR
more info
Comet C/1999 Y1 was discovered on 20 December 1999 with Lincoln Laboratory Near-Earth Asteroid Research project, that is 3 months before its perihelion passage. Next, it was found on earlier images taken on 29 and 30 October 1999 with the same project. It was observed until 19 July 2003.
This is a comet with nongravitational effects strongly manifested in positional data fitting.
Comet had its closest approach to the Earth on 3 November 2000 (2.497 au), more than 4.5 months before its perihelion passage.
Solutions given here are based on data spanning over 3.720 yr in a range of heliocentric distances: 5.60 au – 3.091 au (perihelion) – 7.91 au.
This Oort spike comet suffers moderate planetary perturbations during its passage through the planetary system; these perturbations lead to a more tight future orbit with semimajor axis of about 3,000 au. See also Królikowska 2020.
| solution description | ||
|---|---|---|
| number of observations | 884 | |
| data interval | 1999 10 29 – 2003 07 19 | |
| data type | perihelion within the observation arc (FULL) | |
| data arc selection | entire data set (STD) | |
| range of heliocentric distances | 5.6 au – 3.09 au (perihelion) – 7.91 au | |
| type of model of motion | NC - non-gravitational orbits for symmetric CO-g(r)-like function | |
| data weighting | YES | |
| number of residuals | 1749 | |
| RMS [arcseconds] | 0.48 | |
| orbit quality class | 1a+ | |
| orbital elements (barycentric ecliptic J2000) | ||
|---|---|---|
| Epoch | 1698 12 25 | |
| perihelion date | 2001 03 24.02400183 | ± 0.00093380 |
| perihelion distance [au] | 3.08398547 | ± 0.00000534 |
| eccentricity | 0.99988299 | ± 0.00000571 |
| argument of perihelion [°] | 184.264929 | ± 0.000148 |
| ascending node [°] | 188.750304 | ± 0.000041 |
| inclination [°] | 134.797923 | ± 0.000013 |
| reciprocal semi-major axis [10-6 au-1] | 37.94 | ± 1.85 |
| file containing 5001 VCs swarm |
|---|
| 1999y1c2.bmi |
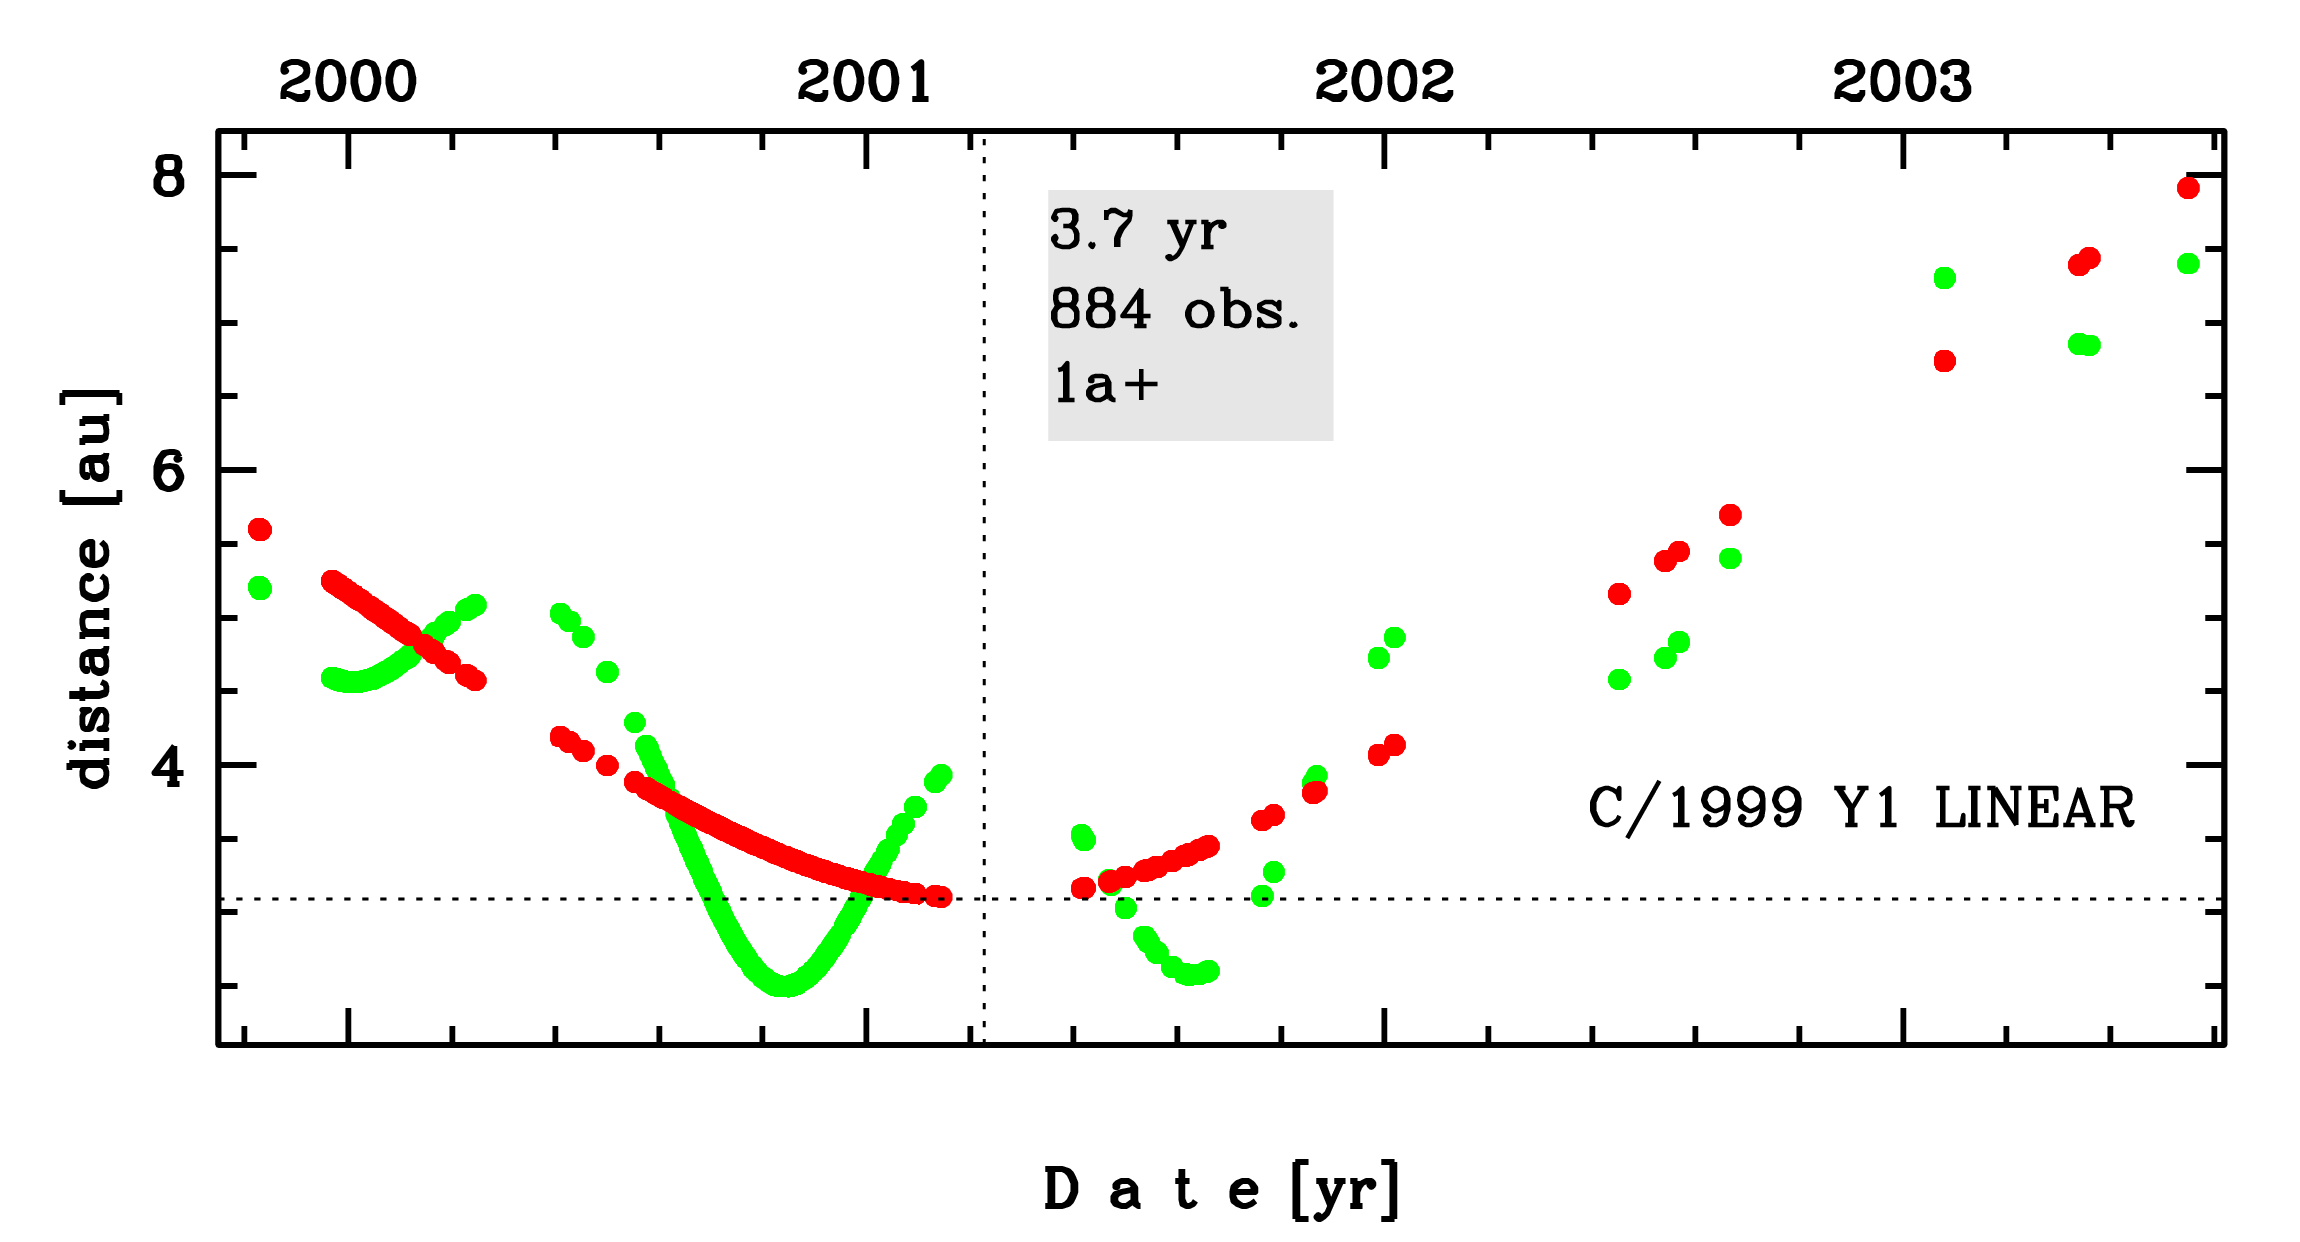
Time distribution of positional observations with corresponding heliocentric (red curve) and geocentric (green curve) distance at which they were taken. The horizontal dotted line shows the perihelion distance for a given comet whereas vertical dotted line — the moment of perihelion passage.
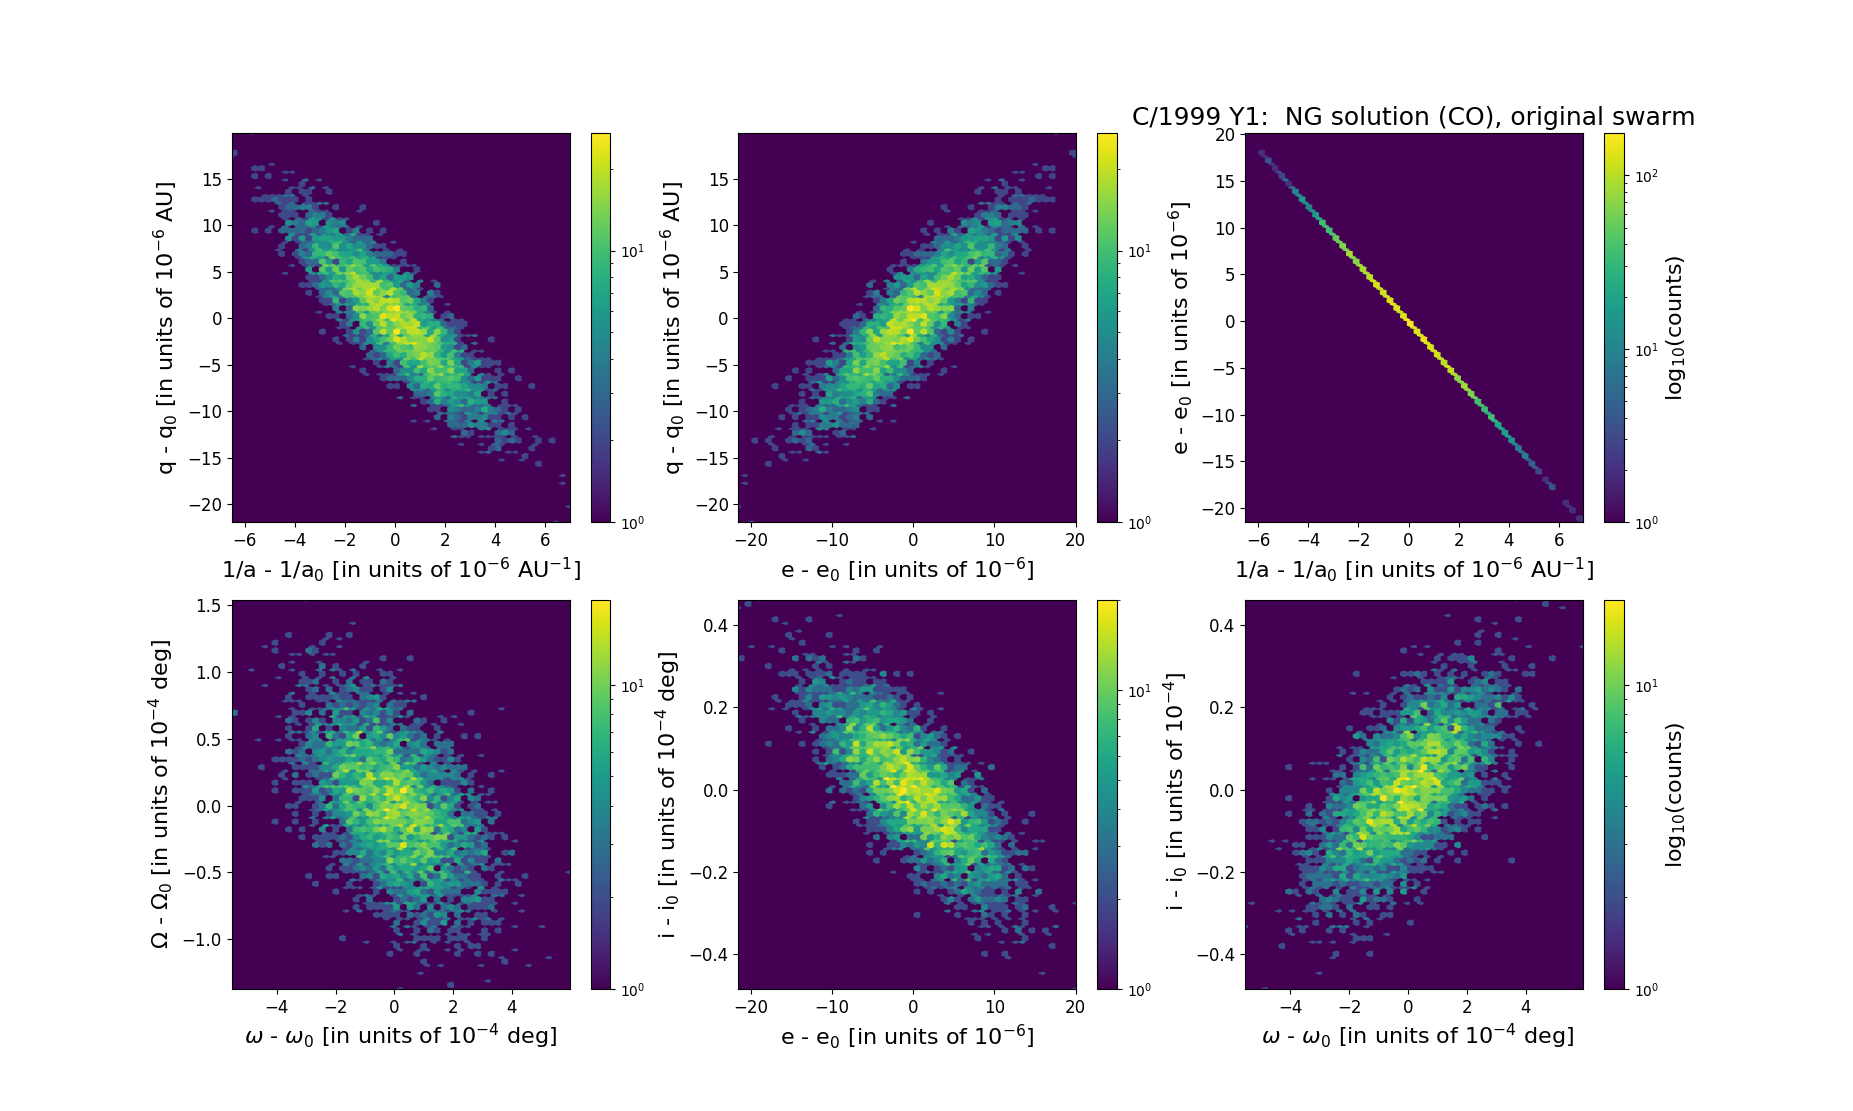
Six 2D-projections of the 6D space of original swarm including 5001 VCs. Each density map is given in logarithmic scale presented on the right in the individual panel.