C/2000 SV74 LINEAR
more info
Comet C/2000 SV74 was discovered on 24 September 2009 by LINEAR as an apparently asteroidal object; CCD images taken by Milos Tichy (Klet Observatory) on 19 October 2000 revealed a cometary appearance [[IAUC 7510, 2000 October 19]. Later, five images of this object were found on LINEAR exposures taken on 5 September 2000. Comet passed perihelion at the end of April 2002.
C/2000 SV74 was observed 4.7 yr in a range of heliocentric distances: 6.26 au – 3.542 au (perihelion) – 9.51 au.
Comet had its closest approach to Earth on 3 November 2001 (3.195 au, six months before perihelion).
Nongravitational solution bbased on entire data arc still reveals some trends in (O-C) where most evident are in the last opposition; NG orbits independently using pre-perihelion and post-perihelion data are also determinable.
Nakano non-gravitational solution [ Nakano Notes 1258] also shows trends in (O-C) in the last opposition. This solution, derived by T. Kobayashi, is based on 2116 observations (arc: 2000 September 5 to 2005 April 15; rms = 0.60 arcsec) and the NG-effects of sublimating CO-molecule (or N2) using Yabushita's theory (MNRAS 283, 347), and gives 1/aorigin = +0.000074, 1/afuture = -0.000073).
See also Królikowska and Dones 2023 and Królikowska and Dybczyński 2017.
| solution description | ||
|---|---|---|
| number of observations | 2203 | |
| data interval | 2000 09 05 – 2005 05 12 | |
| data type | perihelion within the observation arc (FULL) | |
| data arc selection | entire data set (STD) | |
| range of heliocentric distances | 6.26 au – 3.54 au (perihelion) – 9.51 au | |
| type of model of motion | NC - non-gravitational orbits for symmetric CO-g(r)-like function | |
| data weighting | YES | |
| number of residuals | 4382 | |
| RMS [arcseconds] | 0.66 | |
| orbit quality class | 1a+ | |
| next orbit statistics, both Galactic and stellar perturbations were taken into account | ||
|---|---|---|
| no. of returning VCs in the swarm | 0 | |
| no. of escaping VCs in the swarm | 5001 | |
| no. of hyperbolas among escaping VCs in the swarm | 5001 | * |
| next reciprocal semi-major axis [10-6 au-1] | -69.66 – -68.34 – -67.03 | |
| next perihelion distance [au] | 197.5 – 199.3 – 201.2 | |
| synchronous stop epoch [Myr] | 1.71 | S |
| percentage of VCs with qnext > 20 | 100 | |
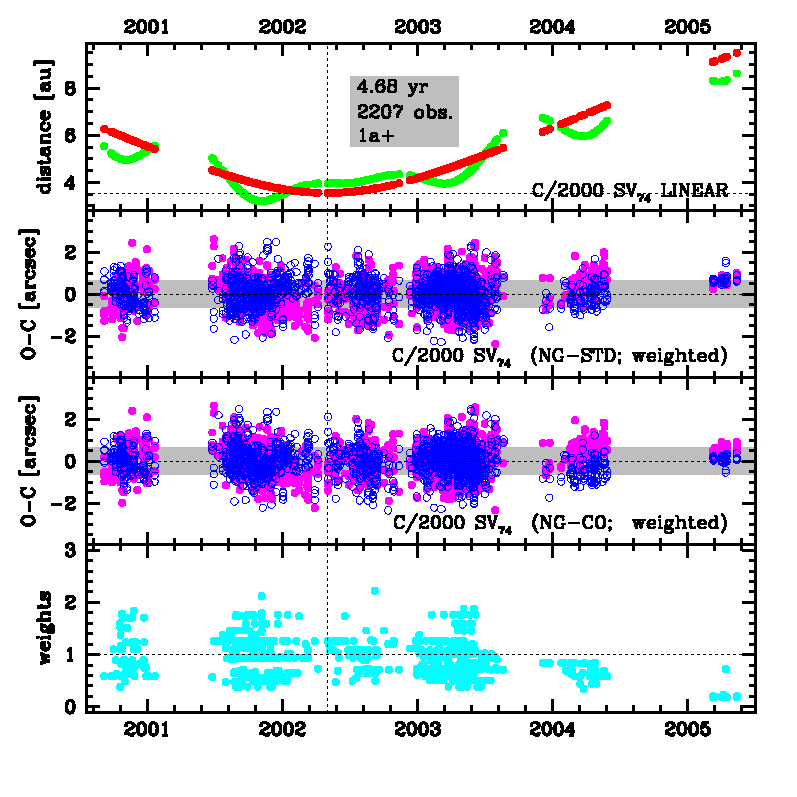
Upper panel: Time distribution of positional observations with corresponding heliocentric (red curve) and geocentric (green curve) distance at which they were taken. The horizontal dotted line shows the perihelion distance for a given comet whereas vertical dotted line — the moment of perihelion passage.
Middle panel(s): O-C diagram for a given solution (sometimes in comparison to another solution available in CODE), where residuals in right ascension are shown using magenta dots and in declination by blue open circles.
Lowest panel: Relative weights for a given data set(s).
Middle panel(s): O-C diagram for a given solution (sometimes in comparison to another solution available in CODE), where residuals in right ascension are shown using magenta dots and in declination by blue open circles.
Lowest panel: Relative weights for a given data set(s).
| next_g orbit statistics, here only the Galactic tide has been included | ||
|---|---|---|
| no. of returning VCs in the swarm | 0 | |
| no. of escaping VCs in the swarm | 5001 | |
| no. of hyperbolas among escaping VCs in the swarm | 5001 | * |
| next reciprocal semi-major axis [10-6 au-1] | -73.06 – -71.72 – -70.39 | |
| next perihelion distance [au] | 0.176 – 0.186 – 0.197 | |
| synchronous stop epoch [Myr] | 1.78 | S |
| percentage of VCs with qnext < 10 | 100 | |