C/2000 W1 Utsunomiya-Jones
more info
Comet C/2000 W1 was discovered on 18 November 2000 by Syogo Utsunomiya (Aso, Kumamoto, Japan), Albert F. Jones (Nelson, New Zealand); that is a bit more than one month before its perihelion passage. It was observed until 23 January 2001.
Comet had its closest approach to the Earth on 25 November 2000 (0.280 au), one week after its discovery.
Solutions given here are based on data spanning over 0.159 yr in a range of heliocentric distances: 0.858 au – 0.321 au (perihelion) – 0.820 au..
This comet (original semimajor axis of about 8,000 au) suffers large planetary perturbations during its passage through the planetary system; these perturbations lead to a significantly more tight future orbit with semimajor axis of about 600 au.
See also Królikowska 2020
| solution description | ||
|---|---|---|
| number of observations | 190 | |
| data interval | 2000 11 26 – 2001 01 23 | |
| data type | perihelion within the observation arc (FULL) | |
| data arc selection | entire data set (STD) | |
| range of heliocentric distances | 0.85 au – 0.32 au (perihelion) – 0.82 au | |
| type of model of motion | NS - non-gravitational orbits for standard g(r) | |
| data weighting | YES | |
| number of residuals | 367 | |
| RMS [arcseconds] | 0.73 | |
| orbit quality class | 2a | |
| previous orbit statistics, both Galactic and stellar perturbations were taken into account | ||
|---|---|---|
| no. of returning VCs in the swarm | 5001 | * |
| no. of escaping VCs in the swarm | 0 | |
| no. of hyperbolas among escaping VCs in the swarm | 0 | |
| previous reciprocal semi-major axis [10-6 au-1] | 96.69 – 121.51 – 146.32 | |
| previous perihelion distance [au] | 0.228 – 0.278 – 0.299 | |
| previous aphelion distance [103 au] | 14 – 16 – 21 | |
| time interval to previous perihelion [Myr] | 0.56 – 0.75 – 1.1 | |
| percentage of VCs with qprev < 10 | 100 | |
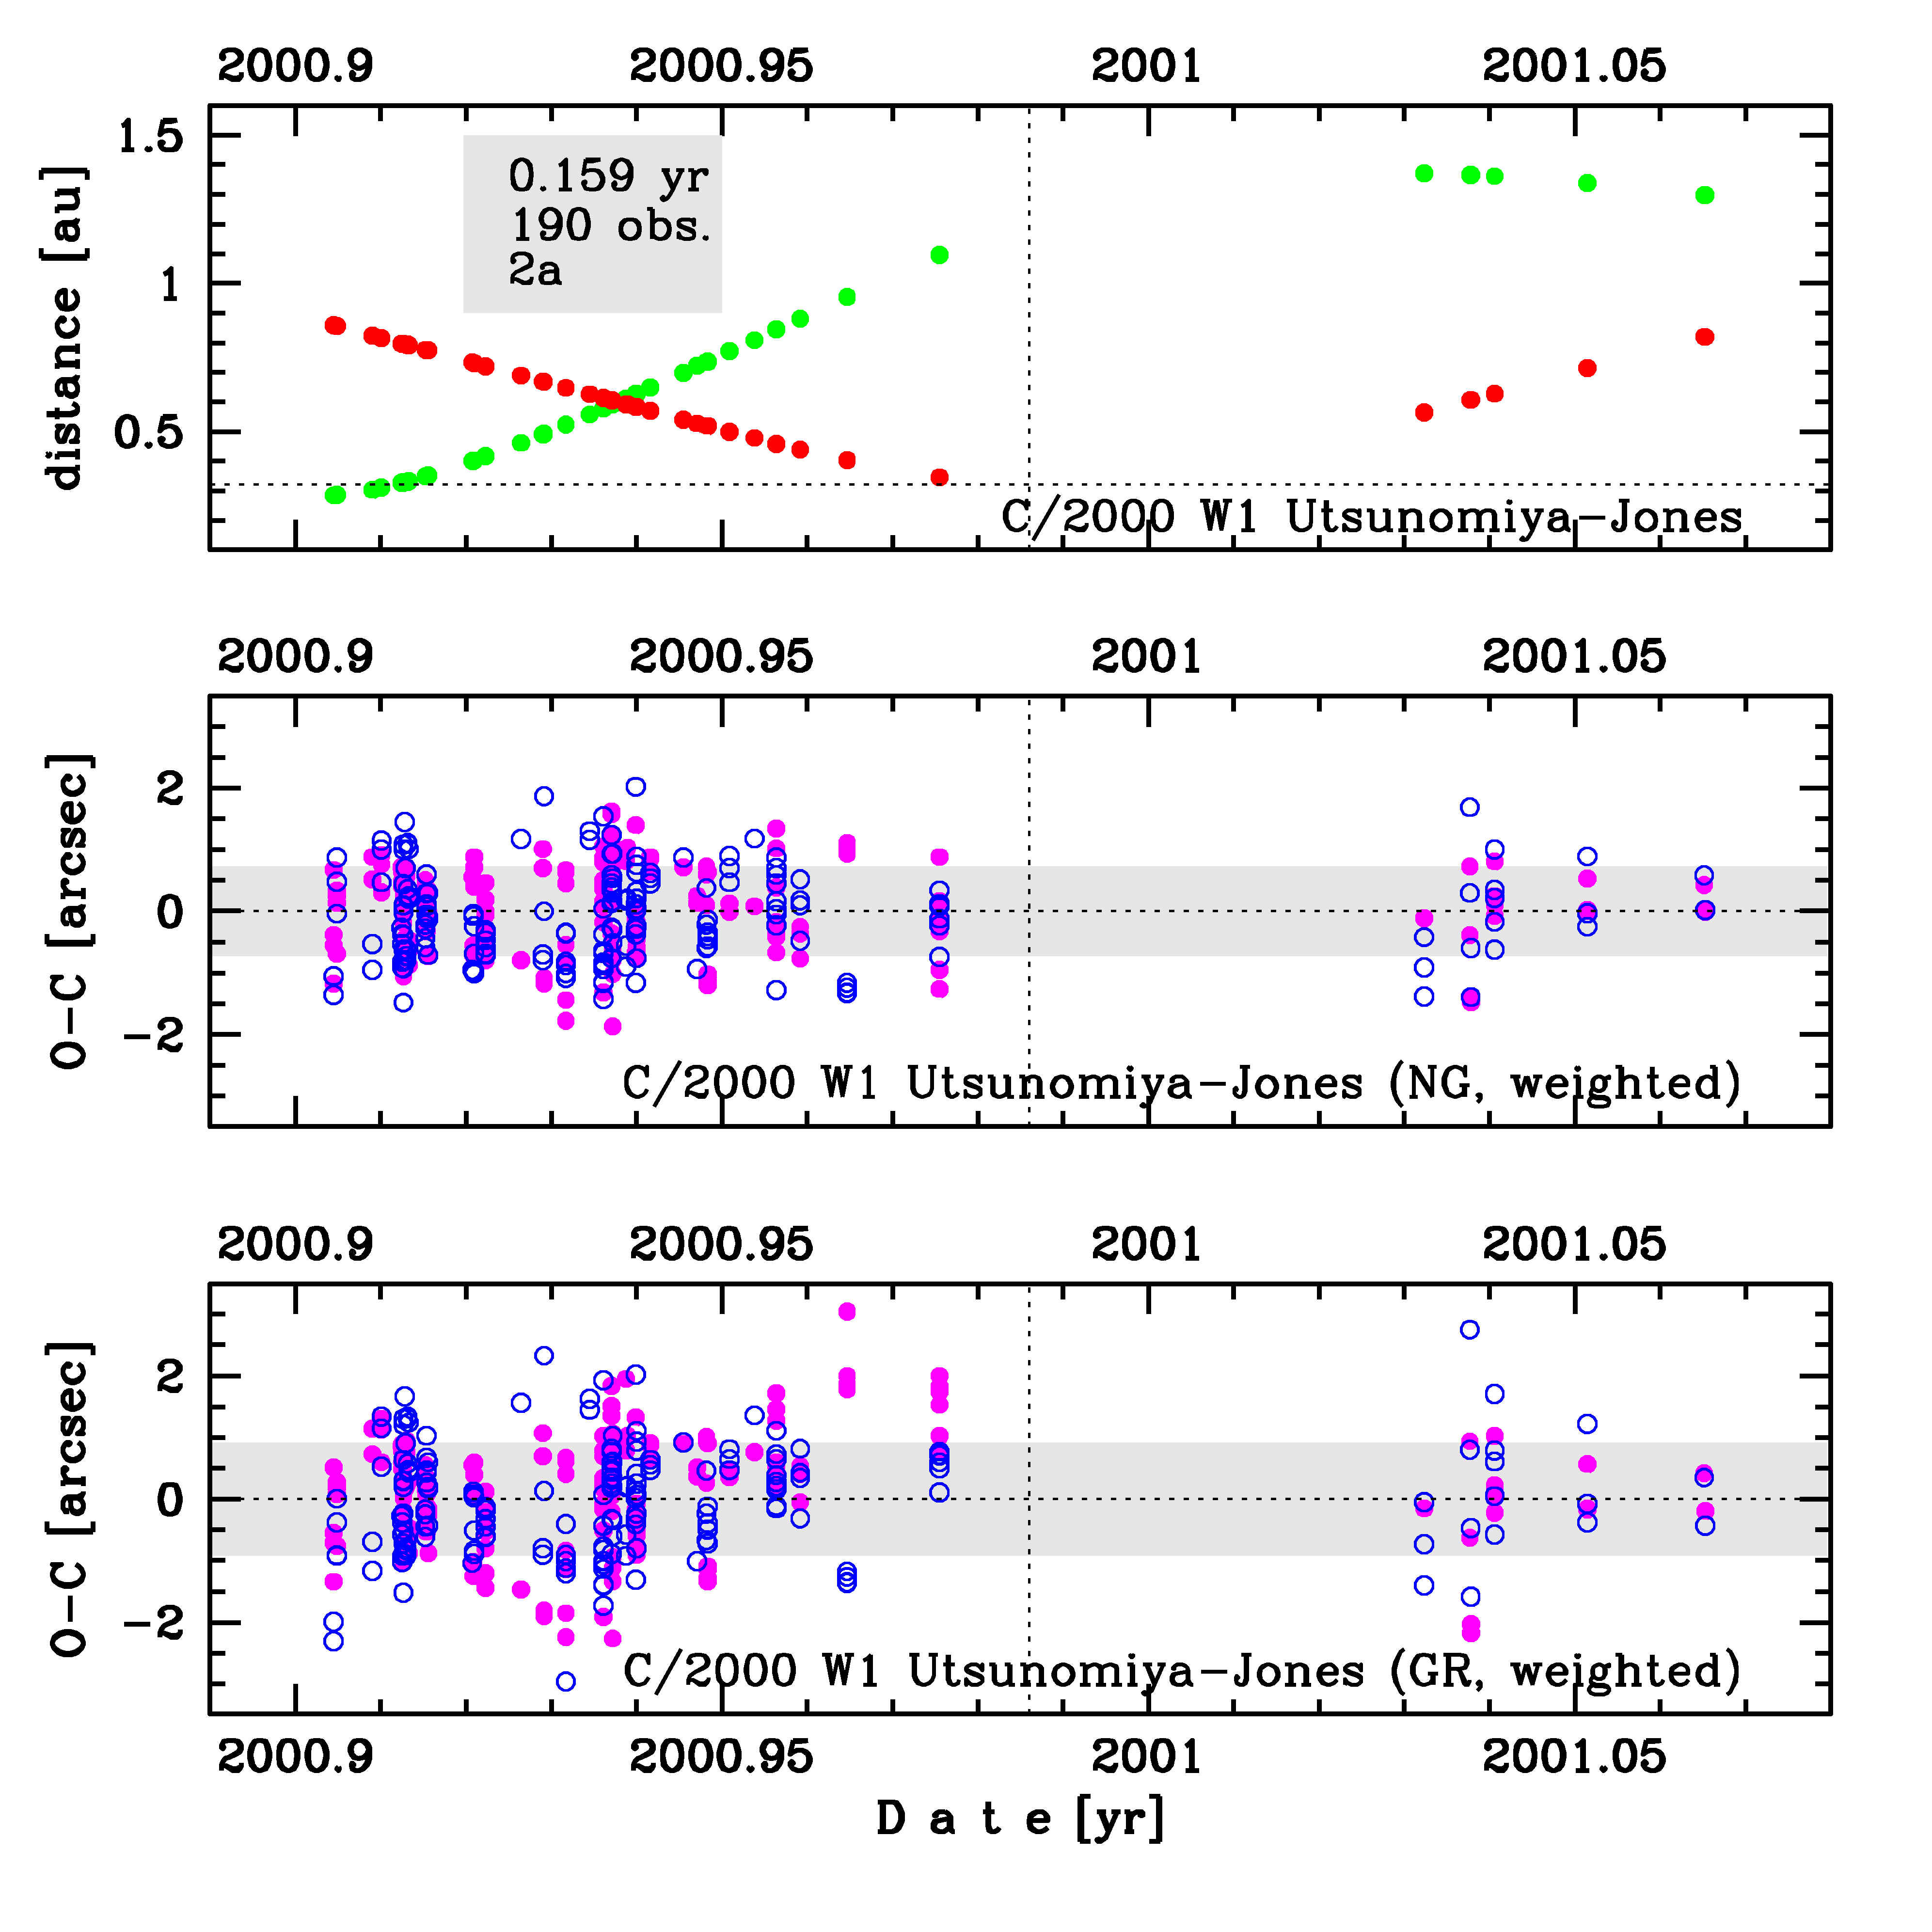
Upper panel: Time distribution of positional observations with corresponding heliocentric (red curve) and geocentric (green curve) distance at which they were taken. The horizontal dotted line shows the perihelion distance for a given comet whereas vertical dotted line — the moment of perihelion passage.
Lower panel (panels): O-C diagram for this(two) solution (solutions) given in this database, where residuals in right ascension are shown using magenta dots and in declination by blue open circles.
Lower panel (panels): O-C diagram for this(two) solution (solutions) given in this database, where residuals in right ascension are shown using magenta dots and in declination by blue open circles.
| previous_g orbit statistics, here only the Galactic tide has been included | ||
|---|---|---|
| no. of returning VCs in the swarm | 5001 | * |
| no. of escaping VCs in the swarm | 0 | |
| no. of hyperbolas among escaping VCs in the swarm | 0 | |
| previous reciprocal semi-major axis [10-6 au-1] | 96.69 – 121.51 – 146.32 | |
| previous perihelion distance [au] | 0.237 – 0.28 – 0.298 | |
| previous aphelion distance [103 au] | 14 – 16 – 21 | |
| time interval to previous perihelion [Myr] | 0.56 – 0.75 – 1.1 | |
| percentage of VCs with qprev < 10 | 100 | |