C/2000 Y1 Tubbiolo
more info
C/2000 Y1 was discovered on 16 December 2000 by A.F. Tubbiolo with the 0.9m Spacewatch telescope at Kitt Peak. At once, pre-discovery detections by LINEAR going back to 24 October 2000 were found [IAUC 7544, 2000 December 18].
This comet made its closest approach to the Earth on 23 November 2000 (7.000 au), 2.3 months before perihelion.
Solution given here is based on data spanning over 2.0 yr in a range of heliocentric distances: 8.00 au – 7.975 au (perihelion) – 8.86 au.
This Oort spike comet suffers tiny planetary perturbations during its passage through the planetary system; however, they could lead to escape of the comet from the solar system on hiperbolic orbit (see future barycentric orbit).
See also Królikowska 2014 and Królikowska and Dybczyński 2017.
| solution description | ||
|---|---|---|
| number of observations | 94 | |
| data interval | 2000 10 24 – 2002 11 05 | |
| data type | perihelion within the observation arc (FULL) | |
| data arc selection | entire data set (STD) | |
| range of heliocentric distances | 8 au – 7.97 au (perihelion) – 8.86 au | |
| detectability of NG effects in the comet's motion | NG effects not determinable | |
| type of model of motion | GR - gravitational orbit | |
| data weighting | NO | |
| number of residuals | 185 | |
| RMS [arcseconds] | 0.74 | |
| orbit quality class | 1a | |
| previous orbit statistics, both Galactic and stellar perturbations were taken into account | ||
|---|---|---|
| no. of returning VCs in the swarm | 5001 | * |
| no. of escaping VCs in the swarm | 0 | |
| no. of hyperbolas among escaping VCs in the swarm | 0 | |
| previous reciprocal semi-major axis [10-6 au-1] | 56.39 – 60.78 – 65.81 | |
| previous perihelion distance [au] | 11.5 – 12.8 – 14 | |
| previous aphelion distance [103 au] | 30.4 – 32.9 – 35.5 | |
| time interval to previous perihelion [Myr] | 1.9 – 2.1 – 2.5 | |
| percentage of VCs with qprev < 10 | 6 | |
| percentage of VCs with 10 < qprev < 20 | 92 | |
| percentage of VCs with qprev > 20 | 2 | |
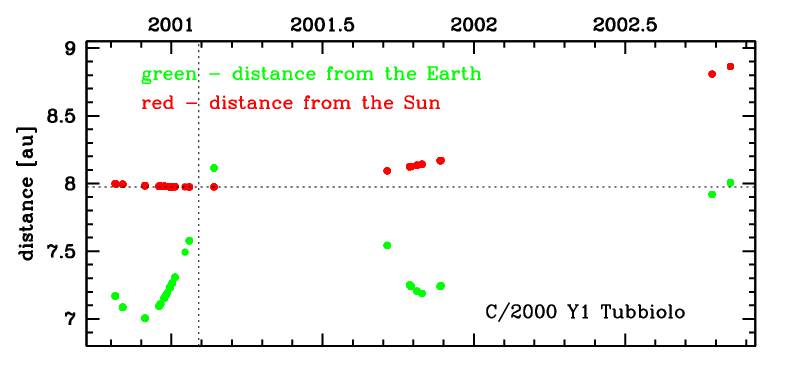
Time distribution of positional observations with corresponding heliocentric (red curve) and geocentric (green curve) distance at which they were taken. The horizontal dotted line shows the perihelion distance for a given comet whereas vertical dotted line — the moment of perihelion passage.
| previous_g orbit statistics, here only the Galactic tide has been included | ||
|---|---|---|
| no. of returning VCs in the swarm | 5001 | * |
| no. of escaping VCs in the swarm | 0 | |
| no. of hyperbolas among escaping VCs in the swarm | 0 | |
| previous reciprocal semi-major axis [10-6 au-1] | 54.90 – 60.35 – 65.83 | |
| previous perihelion distance [au] | 9.93 – 10.7 – 11.9 | |
| previous aphelion distance [103 au] | 30.4 – 33.1 – 36.4 | |
| time interval to previous perihelion [Myr] | 1.9 – 2.1 – 2.5 | |
| percentage of VCs with qprev < 10 | 13 | |
| percentage of VCs with 10 < qprev < 20 | 87 | |