C/2002 E2 Snyder-Murakami
more info
Comet C/2002 E2 was discovered on 11 March 2002 by Douglas Snyder (Arizona, US) and Shigeki Murakami (Niigata, Japan), that is about 3 weeks after its perihelion passage. Some earlier images of this comet were next found in Klet Observatory (Czech Republic), Ondřejov Observatory (Czech Republic) and Saku Observatory (Japan), expanding data-arc back in time to 8 March. It was observed until 8 January 2003.
Comet had its closest approach to the Earth on 8 April 2002 (1.367 au), less than a month after discovery.
Solutions given here are based on data spanning over 0.827 yr in a range of heliocentric distances from 1.48 au to 4.18 au.
This Oort spike comet suffers moderate planetary perturbations during its passage through the planetary system; these perturbations lead to escape the comet from the planetary zone on a hyperbolic orbit (see future barycentric orbits).
See also Królikowska 2014.
| solution description | ||
|---|---|---|
| number of observations | 940 | |
| data interval | 2002 03 08 – 2003 01 08 | |
| data type | observed only after perihelion (POST) | |
| data arc selection | entire data set (STD) | |
| range of heliocentric distances | 1.48 au – 4.18au | |
| type of model of motion | NS - non-gravitational orbits for standard g(r) | |
| data weighting | YES | |
| number of residuals | 1863 | |
| RMS [arcseconds] | 0.57 | |
| orbit quality class | 1b | |
| orbital elements (barycentric ecliptic J2000) | ||
|---|---|---|
| Epoch | 2296 04 14 | |
| perihelion date | 2002 02 22.04615751 | ± 0.00022619 |
| perihelion distance [au] | 1.46932103 | ± 0.00000117 |
| eccentricity | 1.00064899 | ± 0.00000410 |
| argument of perihelion [°] | 9.082564 | ± 0.000082 |
| ascending node [°] | 244.579630 | ± 0.000030 |
| inclination [°] | 92.4931 | ± 0.000011 |
| reciprocal semi-major axis [10-6 au-1] | -441.69 | ± 2.79 |
| file containing 5001 VCs swarm |
|---|
| 2002e2n1.bpl |

Time distribution of positional observations with corresponding heliocentric (red curve) and geocentric (green curve) distance at which they were taken. The horizontal dotted line shows the perihelion distance for a given comet whereas vertical dotted line — the moment of perihelion passage.
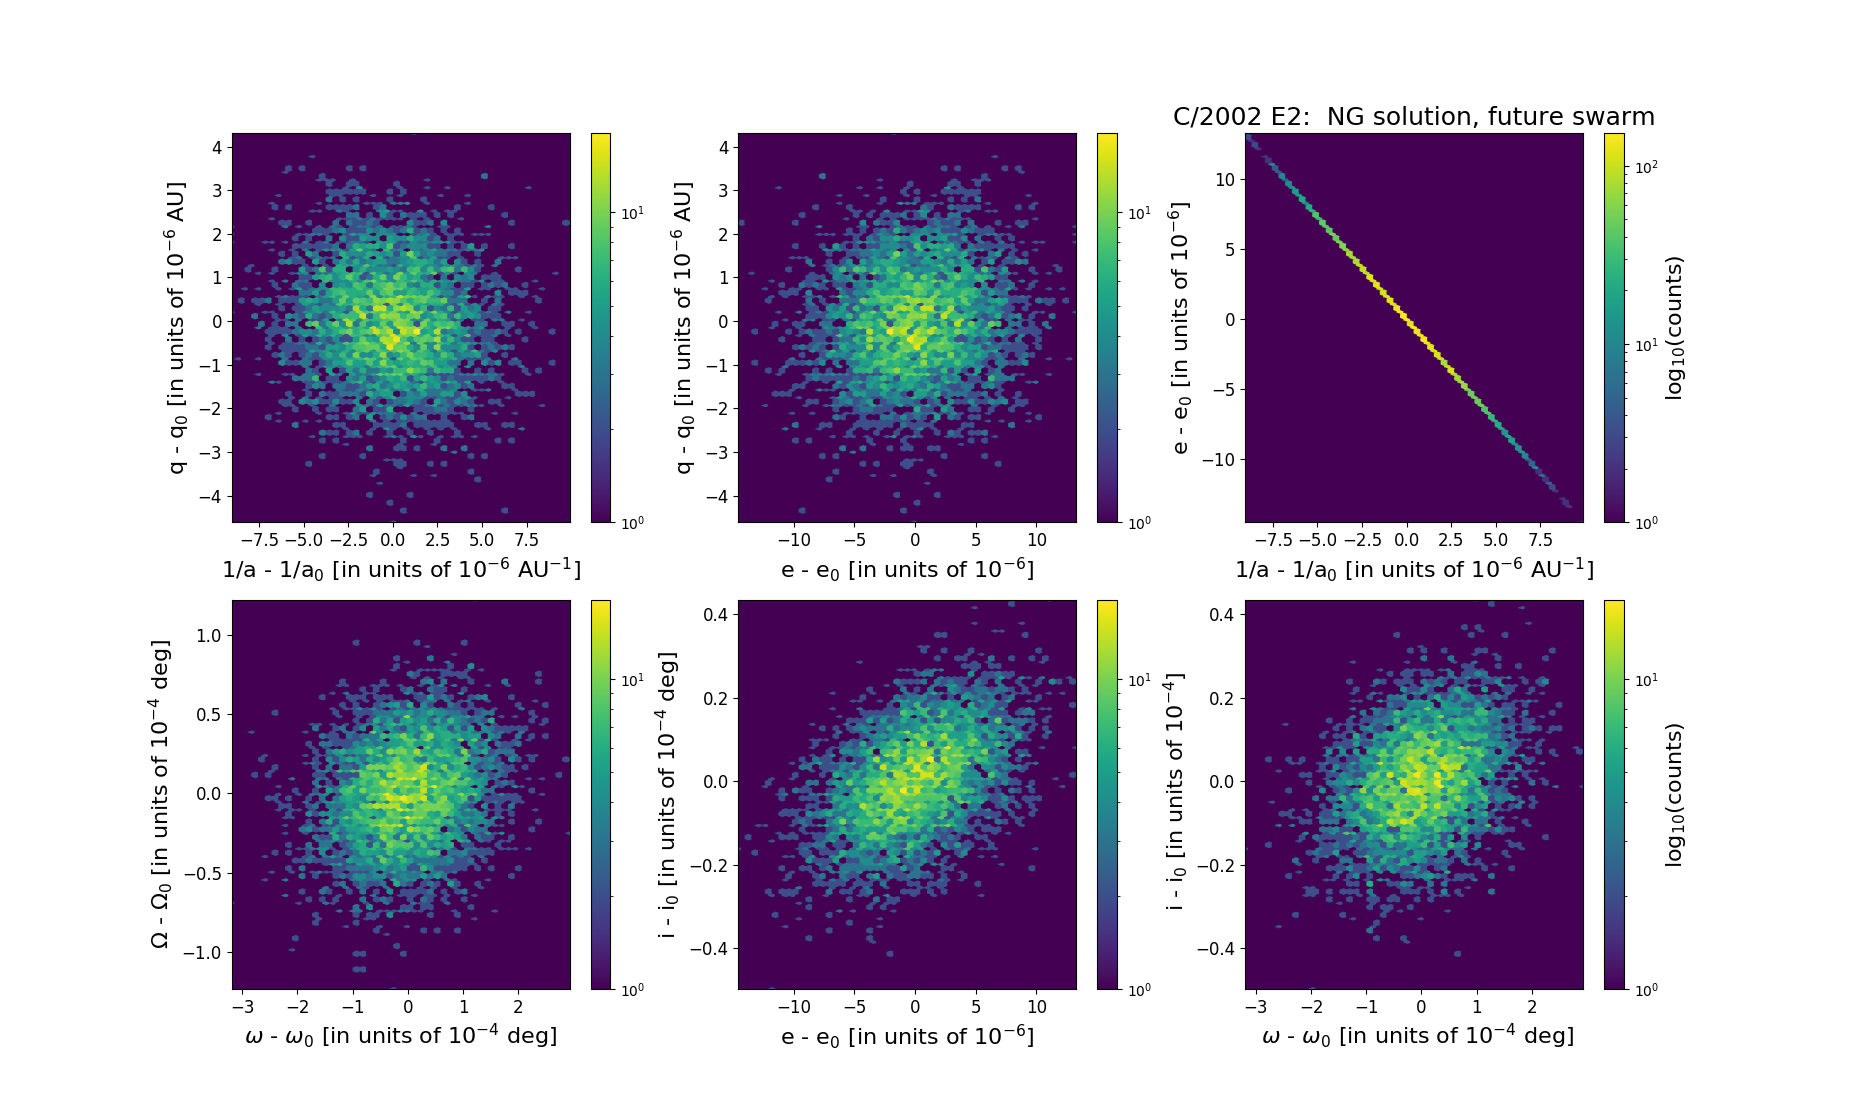
Six 2D-projections of the 6D space of future swarm including 5001 VCs. Each density map is given in logarithmic scale presented on the right in the individual panel.