C/2002 O4 Hoenig
more info
Comet C/2002 O4 was discovered on 22 July 2002 by Sebastian Hoenig (Dossenheim, Germany), that is about two months before its perihelion passage. It was observed until 1 October 2002.
Observers reported that C/2002 O4 started to disintegrate a few days before the perihelion, then faded very rapidly prior to perihelion passage; and in mid-October 2002, it was no longer possible to see this comet. Sekanina (2002) speculated that the comet was undergoing a major outburst near the time of its discovery (27 July 2002) and that a major loss of mass triggered by this episode completed in mid-August. The data arc for this comet is extremely short (two months); however, NG effects are easy detectable in its motion.
Preffered solution given here is based on pre-perihelion data spanning over 0.118 yr in a range of heliocentric distances from 1.43 au to 0.895 au (8 September 2002).
Comet had its closest approach to the Earth on 10 August 2002 (0.650 au), about 2 weeks after its discovery.
The NG orbit obtained from the full data arc gives negative original 1/a, whereas the NG orbit derived using a shorter data arc (see preferred orbit) results in a closed original orbit with semimajor axis shorter than 5000 au, indicating that the orbit of this comet is poorly known.
See also Sekanina 2019 and Królikowska 2020.
| solution description | ||
|---|---|---|
| number of observations | 1148 | |
| data interval | 2002 07 27 – 2002 09 08 | |
| data arc selection | data generally limited to pre-perihelion (PRE) | |
| range of heliocentric distances | 1.43 au – 0.89au | |
| type of model of motion | NS - non-gravitational orbits for standard g(r) | |
| data weighting | NO | |
| number of residuals | 2285 | |
| RMS [arcseconds] | 0.48 | |
| orbit quality class | 3a | |
| previous orbit statistics, both Galactic and stellar perturbations were taken into account | ||
|---|---|---|
| no. of returning VCs in the swarm | 4895 | * |
| no. of escaping VCs in the swarm | 106 | |
| no. of hyperbolas among escaping VCs in the swarm | 78 | |
| previous reciprocal semi-major axis [10-6 au-1] | 106.13 – 246.13 – 390.69 | R |
| previous perihelion distance [au] | 0.7765 – 0.7777 – 0.8098 | R |
| previous aphelion distance [103 au] | 5.1 – 8.1 – 19 | R |
| time interval to previous perihelion [Myr] | 0.13 – 0.26 – 0.91 | R |
| percentage of VCs with qprev < 10 | 97 | |
| percentage of VCs with qprev > 20 | 3 | |
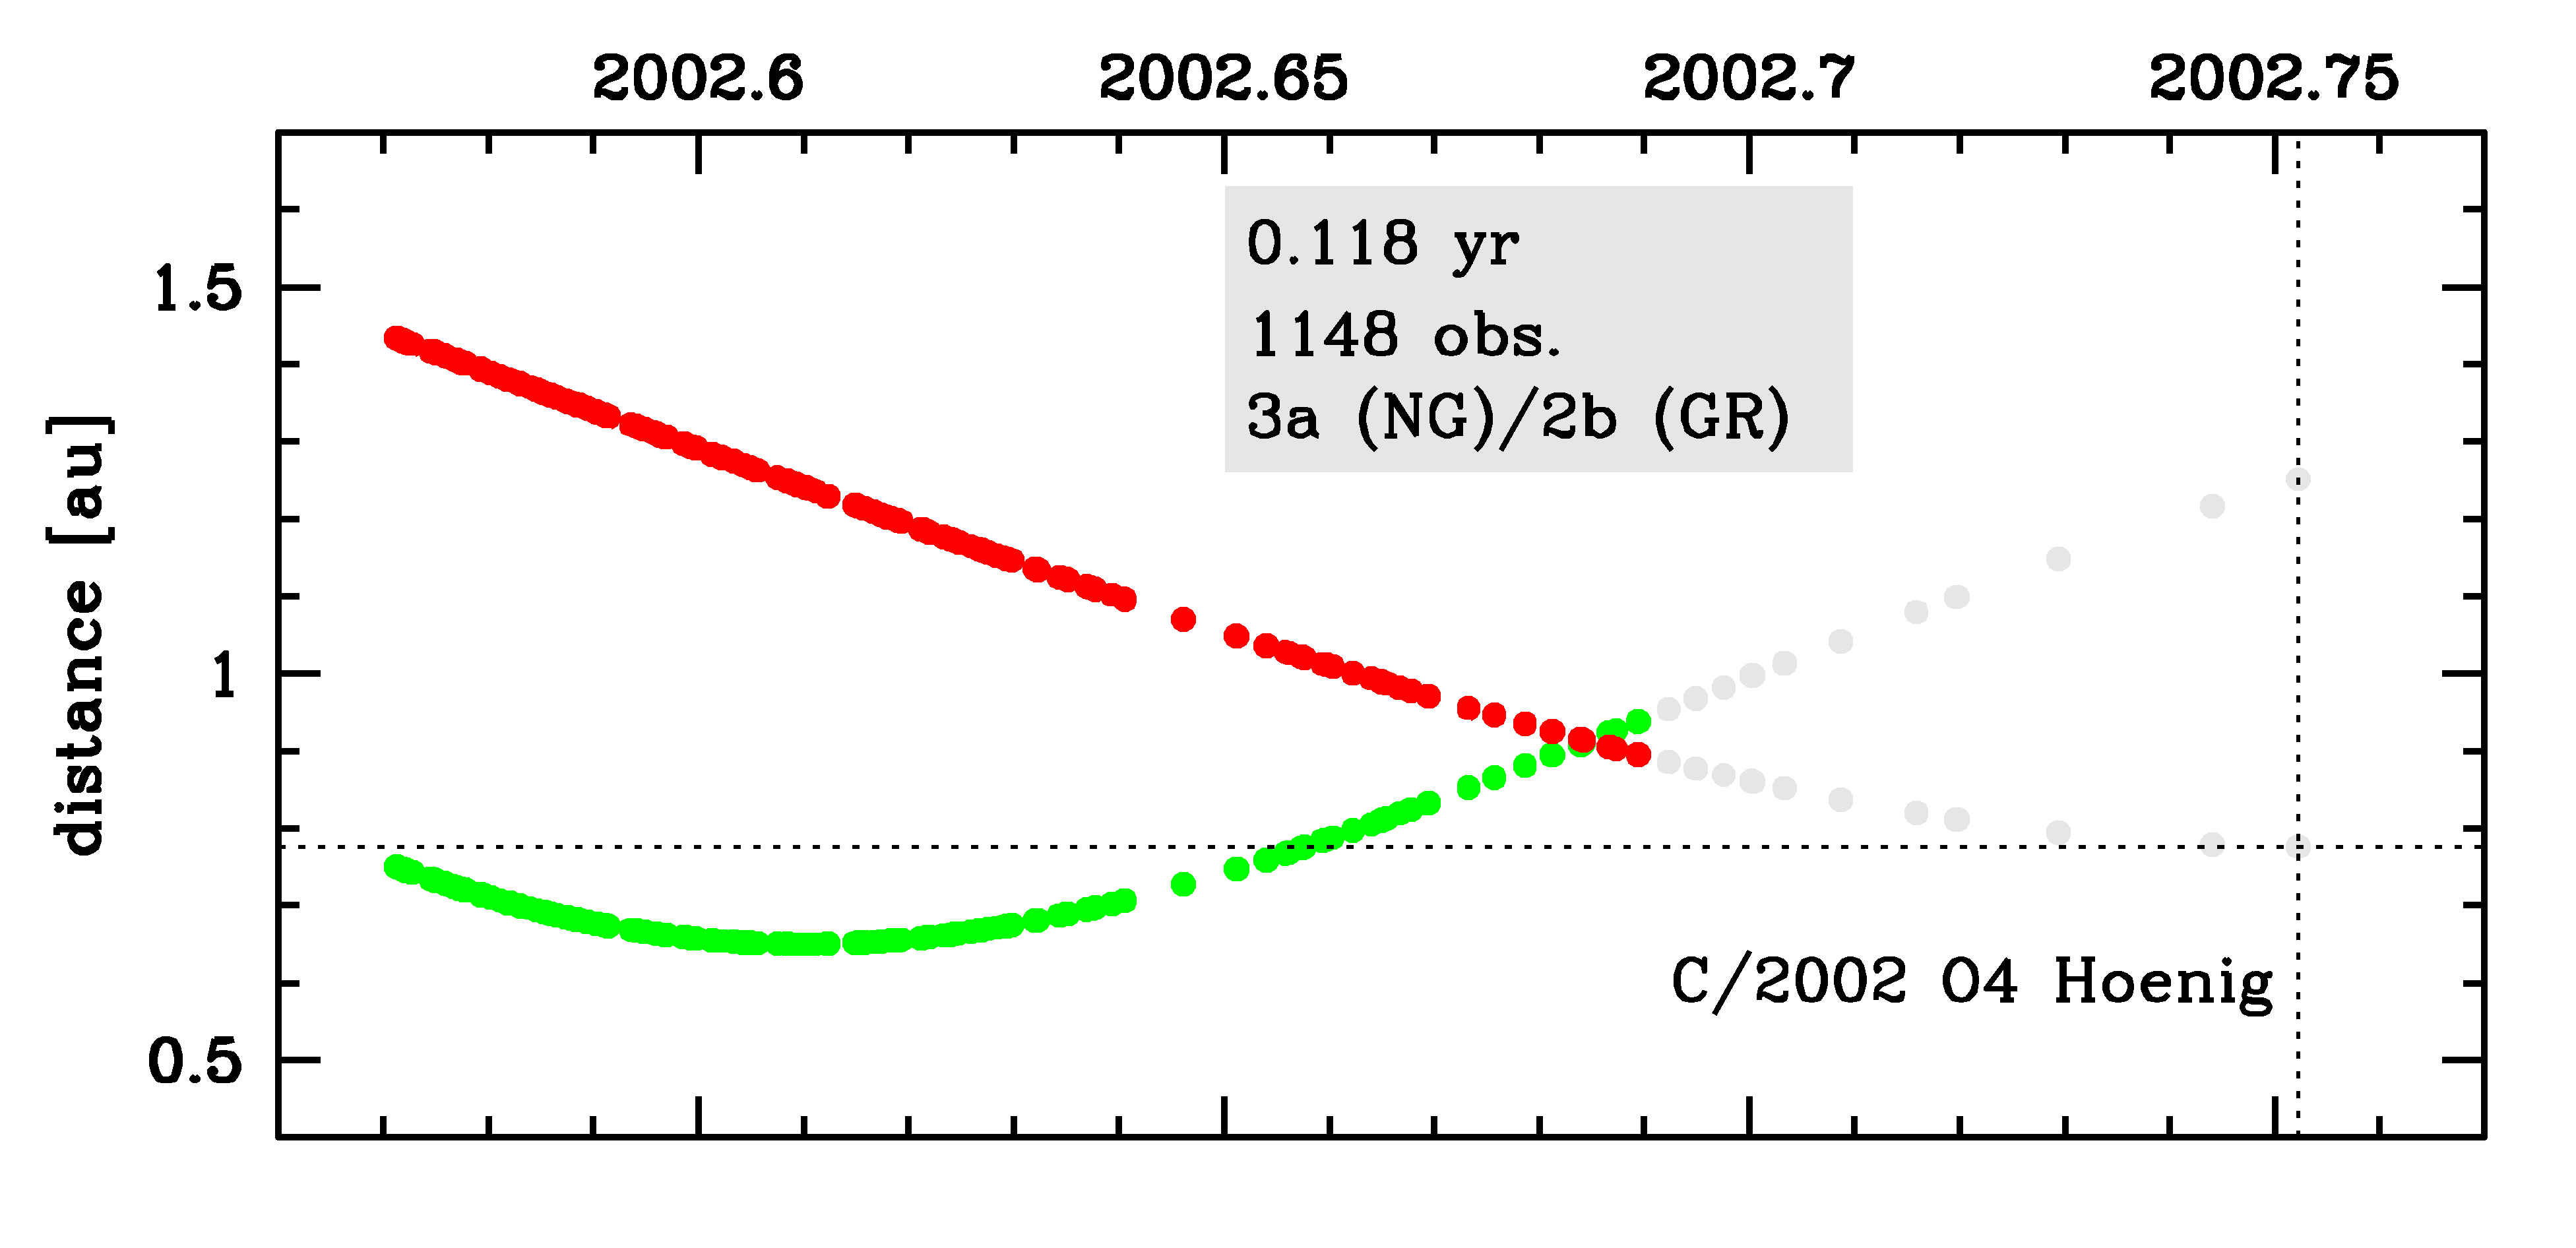
Time distribution of positional observations with corresponding heliocentric (red curve) and geocentric (green curve) distance at which they were taken. The horizontal dotted line shows the perihelion distance for a given comet whereas vertical dotted line — the moment of perihelion passage.
| previous_g orbit statistics, here only the Galactic tide has been included | ||
|---|---|---|
| no. of returning VCs in the swarm | 4891 | * |
| no. of escaping VCs in the swarm | 110 | |
| no. of hyperbolas among escaping VCs in the swarm | 79 | |
| previous reciprocal semi-major axis [10-6 au-1] | 106.78 – 246.27 – 390.69 | R |
| previous perihelion distance [au] | 0.7769 – 0.7786 – 0.8168 | R |
| previous aphelion distance [103 au] | 5.1 – 8.1 – 19 | R |
| time interval to previous perihelion [Myr] | 0.13 – 0.26 – 0.91 | R |
| percentage of VCs with qprev < 10 | 99 | |
| percentage of VCs with qprev > 20 | 1 | |