C/2002 O7 LINEAR
more info
Comet C/2002 O7 was discovered on 29 July 2002 with the Lincoln Laboratory Near-Earth Asteroid Research project, that is about a year and two months before its expected perihelion passage. Mattiazzo (2003) reported that C/2002 O7 was disrupted five days after perihelion, and a month later, the comet could no longer be found.
Comet had its closest approach to the Earth on 20 May 2003 (1.709 au), about 4 months before its perihelion passage.
Preffered solution given here is based on pre-perihelion data taken in perihelion distances larger than 2.44 au, that is spanning over 0.753 yr until 30 April 2003. Two NG solutions based on this shorter data-arc match the data equally, and both can be chosen as preferred solutions (dedicated to water ice ('pn') and CO ('p1') sublimation, respectively). Both these NG solutions give very different original 1/a.
See also Sekanina 2019 and Królikowska 2020.
| solution description | ||
|---|---|---|
| number of observations | 869 | |
| data interval | 2002 07 29 – 2003 04 30 | |
| data arc selection | data generally limited to pre-perihelion (PRE) | |
| range of heliocentric distances | 5.42 au – 2.44au | |
| detectability of NG effects in the comet's motion | comet lost close to perihelion or split comet | |
| type of model of motion | GR - gravitational orbit | |
| data weighting | NO | |
| number of residuals | 1727 | |
| RMS [arcseconds] | 0.79 | |
| orbit quality class | 1b | |
| previous orbit statistics, both Galactic and stellar perturbations were taken into account | ||
|---|---|---|
| no. of returning VCs in the swarm | 4249 | * |
| no. of escaping VCs in the swarm | 752 | |
| no. of hyperbolas among escaping VCs in the swarm | 0 | |
| previous reciprocal semi-major axis [10-6 au-1] | 17.64 – 21.89 – 27.84 | R |
| previous perihelion distance [au] | 877 – 1140 – 1230 | R |
| previous aphelion distance [103 au] | 71 – 90 – 110 | R |
| time interval to previous perihelion [Myr] | 6.7 – 9.4 – 13 | R |
| percentage of VCs with qprev > 20 | 100 | |
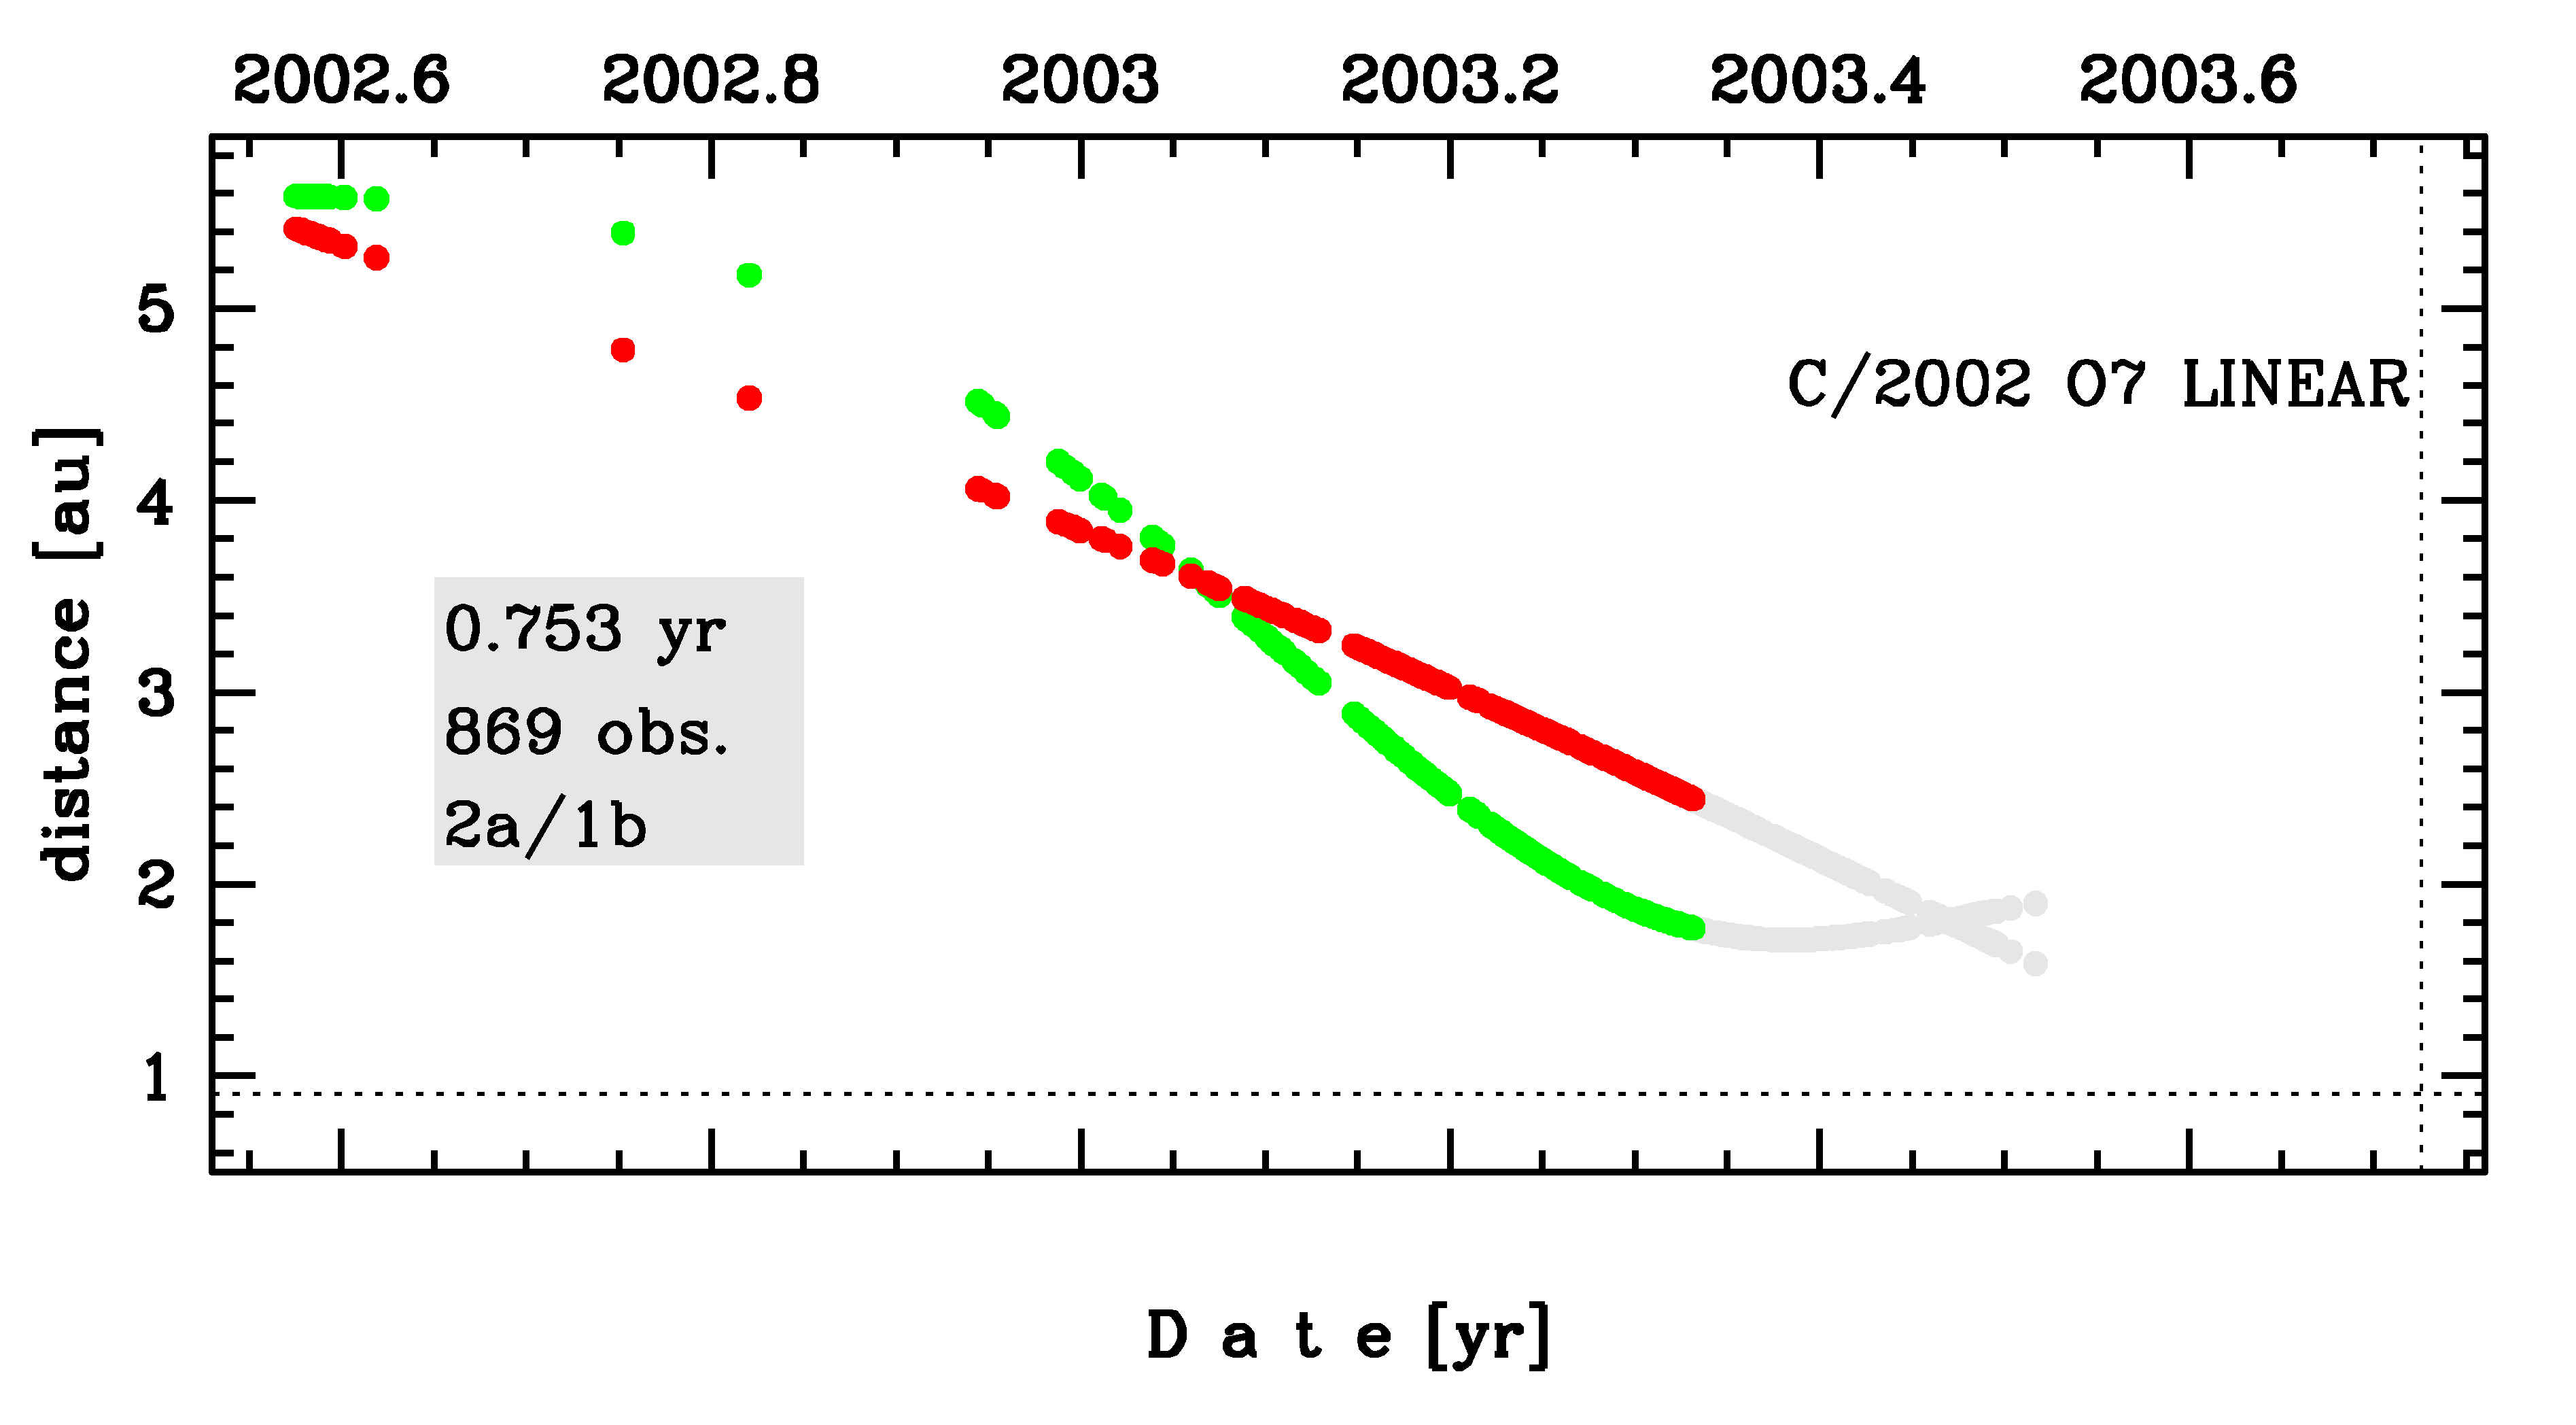
Time distribution of positional observations with corresponding heliocentric (red curve) and geocentric (green curve) distance at which they were taken. The horizontal dotted line shows the perihelion distance for a given comet whereas vertical dotted line — the moment of perihelion passage.
| previous_g orbit statistics, here only the Galactic tide has been included | ||
|---|---|---|
| no. of returning VCs in the swarm | 4553 | * |
| no. of escaping VCs in the swarm | 448 | |
| no. of hyperbolas among escaping VCs in the swarm | 0 | |
| previous reciprocal semi-major axis [10-6 au-1] | 18.44 – 23.15 – 28.78 | R |
| previous perihelion distance [au] | 7.7 – 23 – 82 | R |
| previous aphelion distance [103 au] | 69 – 86 – 110 | R |
| time interval to previous perihelion [Myr] | 6.4 – 8.8 – 12 | R |
| percentage of VCs with qprev < 10 | 17 | |
| percentage of VCs with 10 < qprev < 20 | 28 | |
| percentage of VCs with qprev > 20 | 55 | |