C/2003 A2 Gleason
more info
Comet C/2003 A2 was discovered on 10 January 2002 by Arianna E. Gleason using the Spacewatch II telescope at the Kitt Peak National Observatory when the comet was a year and 10 months before its perihelion passage. This comet was observed 3.2 yr during its four oppositions in a narrow range of heliocentric distances: 11.9 au – 11.43 au (perihelion) – 11.70 au. However, there is a long pause around perihelion lasting over 7 months (from 1 April to 11 November of 2002).
Comet had its closest approach to the Earth on 14 February 2004 (10.451 au).
This Oort spike comet suffers minor planetary perturbations during its passage through the planetary system that lead to a more tight future orbit (see future barycentric orbit).
See also Królikowska and Dybczyński 2017.
Comet had its closest approach to the Earth on 14 February 2004 (10.451 au).
This Oort spike comet suffers minor planetary perturbations during its passage through the planetary system that lead to a more tight future orbit (see future barycentric orbit).
See also Królikowska and Dybczyński 2017.
| solution description | ||
|---|---|---|
| number of observations | 149 | |
| data interval | 2002 01 08 – 2005 03 31 | |
| data type | significantly more measurements before perihelion (PRE+) | |
| data arc selection | entire data set (STD) | |
| range of heliocentric distances | 11.9 au – 11.43 au (perihelion) – 11.7 au | |
| detectability of NG effects in the comet's motion | NG effects not determinable | |
| type of model of motion | GR - gravitational orbit | |
| data weighting | YES | |
| number of residuals | 297 | |
| RMS [arcseconds] | 0.53 | |
| orbit quality class | 1a | |
| next orbit statistics, both Galactic and stellar perturbations were taken into account | ||
|---|---|---|
| no. of returning VCs in the swarm | 5001 | * |
| no. of escaping VCs in the swarm | 0 | |
| no. of hyperbolas among escaping VCs in the swarm | 0 | |
| next reciprocal semi-major axis [10-6 au-1] | 130.96 – 134.22 – 137.48 | |
| next perihelion distance [au] | 11.24 – 11.26 – 11.27 | |
| next aphelion distance [103 au] | 14.5 – 14.9 – 15.3 | |
| time interval to next perihelion [Myr] | 0.62 – 0.642 – 0.666 | |
| percentage of VCs with 10 < qnext < 20 | 100 | |
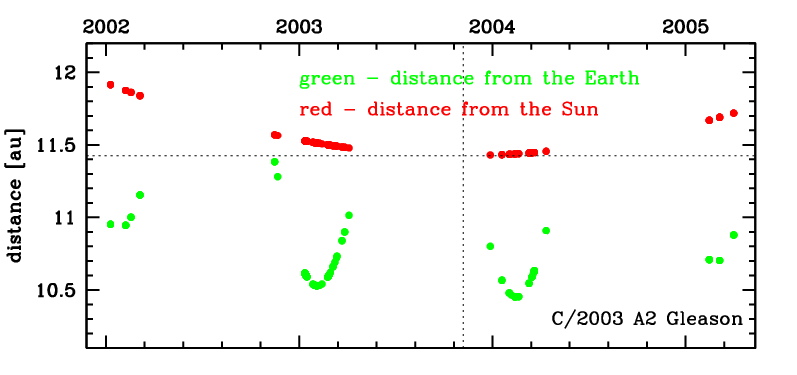
Time distribution of positional observations with corresponding heliocentric (red curve) and geocentric (green curve) distance at which they were taken. The horizontal dotted line shows the perihelion distance for a given comet whereas vertical dotted line — the moment of perihelion passage.
| next_g orbit statistics, here only the Galactic tide has been included | ||
|---|---|---|
| no. of returning VCs in the swarm | 5001 | * |
| no. of escaping VCs in the swarm | 0 | |
| no. of hyperbolas among escaping VCs in the swarm | 0 | |
| next reciprocal semi-major axis [10-6 au-1] | 130.97 – 134.22 – 137.48 | |
| next perihelion distance [au] | 11.22 – 11.23 – 11.25 | |
| next aphelion distance [103 au] | 14.5 – 14.9 – 15.3 | |
| time interval to next perihelion [Myr] | 0.62 – 0.642 – 0.666 | |
| percentage of VCs with 10 < qnext < 20 | 100 | |