C/2003 G1 LINEAR
more info
C/2003 G1 was discovered on 8 April 2003 by the LINEAR as an apparently asteroidal object. In the next two days its cometary apperance was reported by many observers [IAUC 8115, 2003 April 10]. At the moment of discovery it was about 2 months after its perihelion passage.
This comet made its closest approach to the Earth on 31 May 2003 (4.103 au), almost four months after perihelion.
Solution given here is based on data spanning over 1.5 yr in a range of heliocentric distances from 4.94 au to 6.77 au.
This Oort spike comet suffers moderate planetary perturbations during its passage through the planetary system that lead to escape of the comet from the solar system on hiperbolic orbit (see future barycentric orbit).
See also Królikowska 2014 and Królikowska and Dybczyński 2017.
| solution description | ||
|---|---|---|
| number of observations | 1484 | |
| data interval | 2003 04 08 – 2004 10 14 | |
| data type | observed only after perihelion (POST) | |
| data arc selection | entire data set (STD) | |
| range of heliocentric distances | 4.94 au – 6.77au | |
| detectability of NG effects in the comet's motion | NG effects not determinable | |
| type of model of motion | GR - gravitational orbit | |
| data weighting | YES | |
| number of residuals | 2939 | |
| RMS [arcseconds] | 0.54 | |
| orbit quality class | 1a | |
| orbital elements (barycentric ecliptic J2000) | ||
|---|---|---|
| Epoch | 2303 11 05 | |
| perihelion date | 2003 02 04.31805900 | ± 0.00063400 |
| perihelion distance [au] | 4.92097111 | ± 0.00000351 |
| eccentricity | 1.00183398 | ± 0.00000313 |
| argument of perihelion [°] | 11.495253 | ± 0.000092 |
| ascending node [°] | 246.108010 | ± 0.000010 |
| inclination [°] | 66.818784 | ± 0.000017 |
| reciprocal semi-major axis [10-6 au-1] | -372.69 | ± 0.64 |
| file containing 5001 VCs swarm |
|---|
| 2003g1a2.bpl |
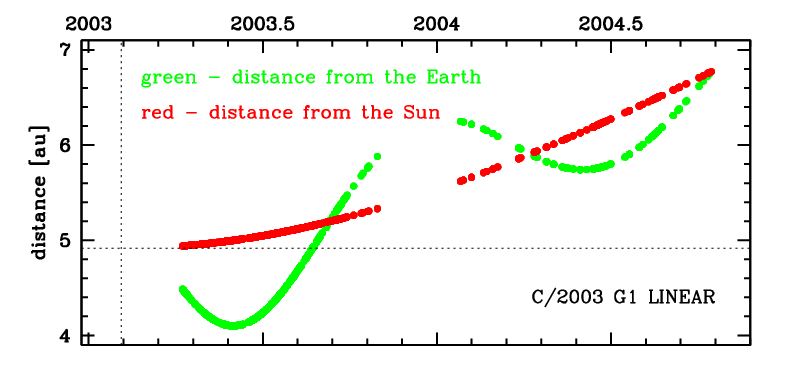
Time distribution of positional observations with corresponding heliocentric (red curve) and geocentric (green curve) distance at which they were taken. The horizontal dotted line shows the perihelion distance for a given comet whereas vertical dotted line — the moment of perihelion passage.
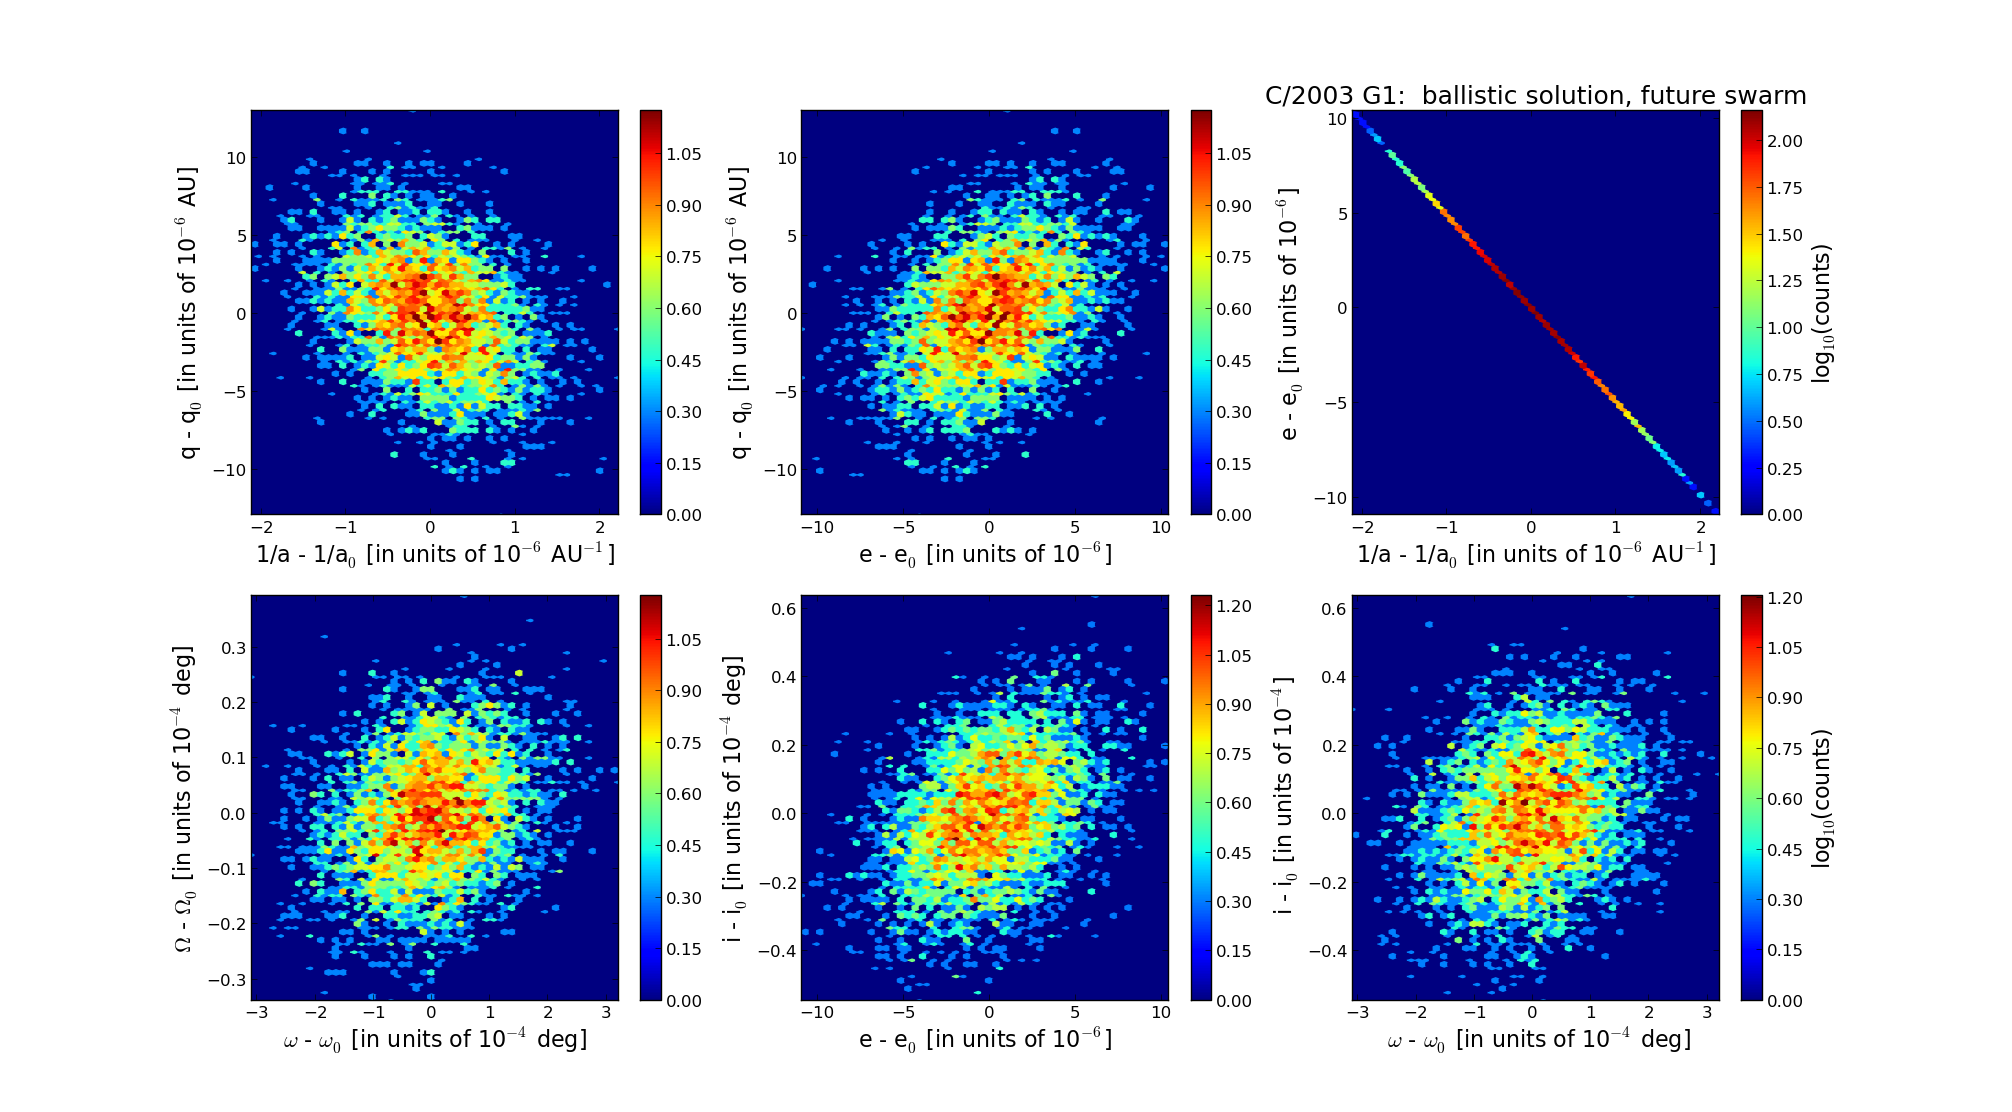
Six 2D-projections of the 6D space of future swarm including 5001 VCs. Each density map is given in logarithmic scale presented on the right in the individual panel.