C/2003 WT42 LINEAR
more info
Comet C/2003 WT42 was discovered on 19 November 2003 by LINEAR as an apparently asteroidal object; observations raported in mid-January 2004 [IAUC 8270, 2004 January 16] demostrated the cometary appearance. Three images of this object were found on LINEAR exposures taken on 30 October 2003. Comet passed perihelion in April 2006.
C/2003 WT42 was observed 4.6 yr during five oppositions in a range of heliocentric distances: 8.26 au – 5.191 au (perihelion) – 7.66 au.
Comet had its closest approach to the Earth on 3 February 2006 (4.403 au, about two months before perihelion).
Pure gravitational solution given here reveals some trends in (O-C) where most prominent are in the last opposition (see lower panel in the figure). It seems that there are any certain NG effects detectable on the basis of positional data. Therefore two other solutions are also given (based on pre-perihelion data and preffered for past dynamical calculatins and post-perihelion data dedicated for the future dynamical evolution).
Solution obtained by Syuichi Nakano [ Nakano Notes 1636] also gives trends in (O-C) in the last opposition; however, many of observations taken in this opposition are discarded, for example all data (14 measurements) after 2008 March 31. His solution is based on 2382 observations (arc: 2003 October 30 to 2008 March 31; rms = 0.60 arcsec) and gives 1/aorigin = +0.000029, 1/afuture = +0.000183).
Solution based on first three oppositions also gives very similar original 1/a to this obtained on the basis of the complete data set (1/aorigin = +0.00047).
This Oort spike comet suffers a minor planetary perturbations during its passage through the planetary system that lead to a more tight future orbit (see future barycentric orbit).
See also Królikowska and Dybczyński 2017.
| solution description | ||
|---|---|---|
| number of observations | 2564 | |
| data interval | 2003 10 30 – 2008 05 25 | |
| data type | perihelion within the observation arc (FULL) | |
| data arc selection | entire data set (STD) | |
| range of heliocentric distances | 8.26 au – 5.19 au (perihelion) – 7.66 au | |
| detectability of NG effects in the comet's motion | NG effects not determinable | |
| type of model of motion | GR - gravitational orbit | |
| data weighting | YES | |
| number of residuals | 5071 | |
| RMS [arcseconds] | 0.44 | |
| orbit quality class | 1a+ | |
| next orbit statistics, both Galactic and stellar perturbations were taken into account | ||
|---|---|---|
| no. of returning VCs in the swarm | 5001 | * |
| no. of escaping VCs in the swarm | 0 | |
| no. of hyperbolas among escaping VCs in the swarm | 0 | |
| next reciprocal semi-major axis [10-6 au-1] | 200.65 – 200.98 – 201.32 | |
| next perihelion distance [au] | 5.16466 – 5.16485 – 5.16504 | |
| next aphelion distance [103 au] | 9.929 – 9.946 – 9.963 | |
| time interval to next perihelion [Myr] | 0.3496 – 0.3504 – 0.3513 | |
| percentage of VCs with qnext < 10 | 100 | |
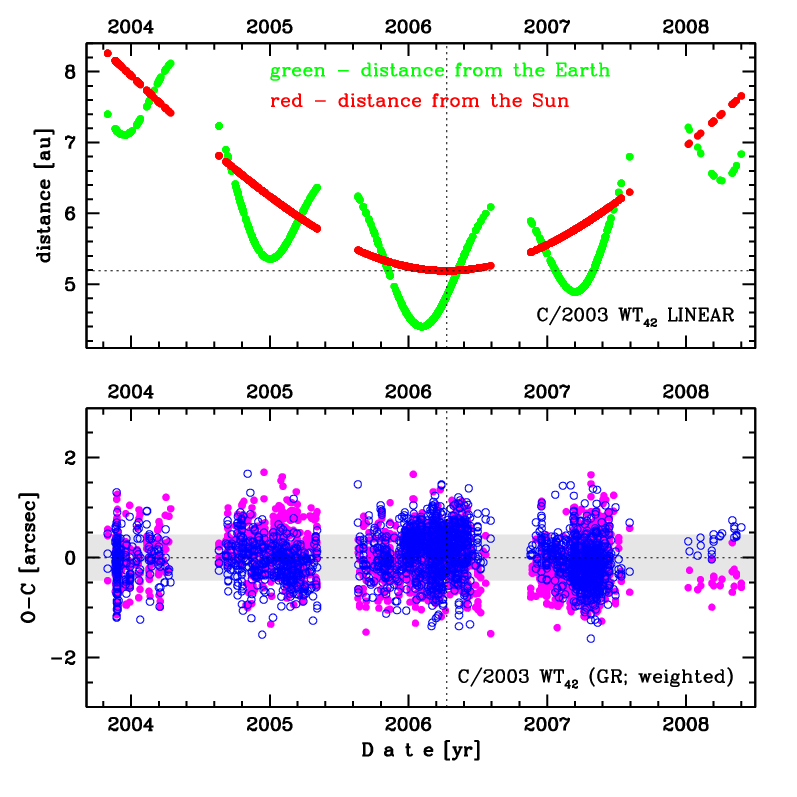
Upper panel: Time distribution of positional observations with corresponding heliocentric (red curve) and geocentric (green curve) distance at which they were taken. The horizontal dotted line shows the perihelion distance for a given comet whereas vertical dotted line — the moment of perihelion passage.
Lower panel (panels): O-C diagram for this(two) solution (solutions) given in this database, where residuals in right ascension are shown using magenta dots and in declination by blue open circles.
Lower panel (panels): O-C diagram for this(two) solution (solutions) given in this database, where residuals in right ascension are shown using magenta dots and in declination by blue open circles.
| next_g orbit statistics, here only the Galactic tide has been included | ||
|---|---|---|
| no. of returning VCs in the swarm | 5001 | * |
| no. of escaping VCs in the swarm | 0 | |
| no. of hyperbolas among escaping VCs in the swarm | 0 | |
| next reciprocal semi-major axis [10-6 au-1] | 200.64 – 200.97 – 201.31 | |
| next perihelion distance [au] | 5.14835 – 5.14854 – 5.14874 | |
| next aphelion distance [103 au] | 9.93 – 9.947 – 9.963 | |
| time interval to next perihelion [Myr] | 0.3496 – 0.3504 – 0.3513 | |
| percentage of VCs with qnext < 10 | 100 | |