C/2006 OF2 Broughton
more info
Comet C/2006 OF2 was discovered on 17 July 2006 by John Broughton (Reedy Creek), that is more than 2 years before its perihelion passage. Next, a few prediscovery images taken on 23 June (Palomar Mountain/NEAT) and 8 July (Siding Spring Survey) were found. It was systematically observed during four oppositions until 11 May 2010.
Comet had its closest approach to the Earth on 9 December 2008 (1.773 au), almost 3 months after its perihelion passage.
Preferred solution given here is based on data taken at large heliocentric distances and spanning over 3.88 yr in a range of heliocentric distances from 3.88 au to 6.31 au.
This Oort spike comet suffers rather large planetary perturbations during its passage through the planetary system and these perturbations lead to escape the comet from the planetary zone on a hyperbolic orbit (see future barycentric orbits).
See also Królikowska and Dybczyński 2013 and Królikowska 2020.
| solution description | ||
|---|---|---|
| number of observations | 1792 | |
| data interval | 2006 06 23 – 2010 05 11 | |
| data arc selection | only data taken in large heliocentric distance (DIS) | |
| range of heliocentric distances | 7.88 au – 2.43 au (perihelion) – 6.31 au | |
| type of model of motion | NS - non-gravitational orbits for standard g(r) | |
| data weighting | YES | |
| number of residuals | 3500 | |
| RMS [arcseconds] | 0.40 | |
| orbit quality class | 1a | |
| orbital elements (barycentric ecliptic J2000) | ||
|---|---|---|
| Epoch | 1707 11 09 | |
| perihelion date | 2008 09 14.94328487 | ± 0.00039970 |
| perihelion distance [au] | 2.42850012 | ± 0.00000205 |
| eccentricity | 0.99996084 | ± 0.00000159 |
| argument of perihelion [°] | 95.624865 | ± 0.000059 |
| ascending node [°] | 318.584531 | ± 0.000005 |
| inclination [°] | 30.143745 | ± 0.000012 |
| reciprocal semi-major axis [10-6 au-1] | 16.13 | ± 0.65 |
| file containing 5001 VCs swarm |
|---|
| 2006ofd5.bmi |
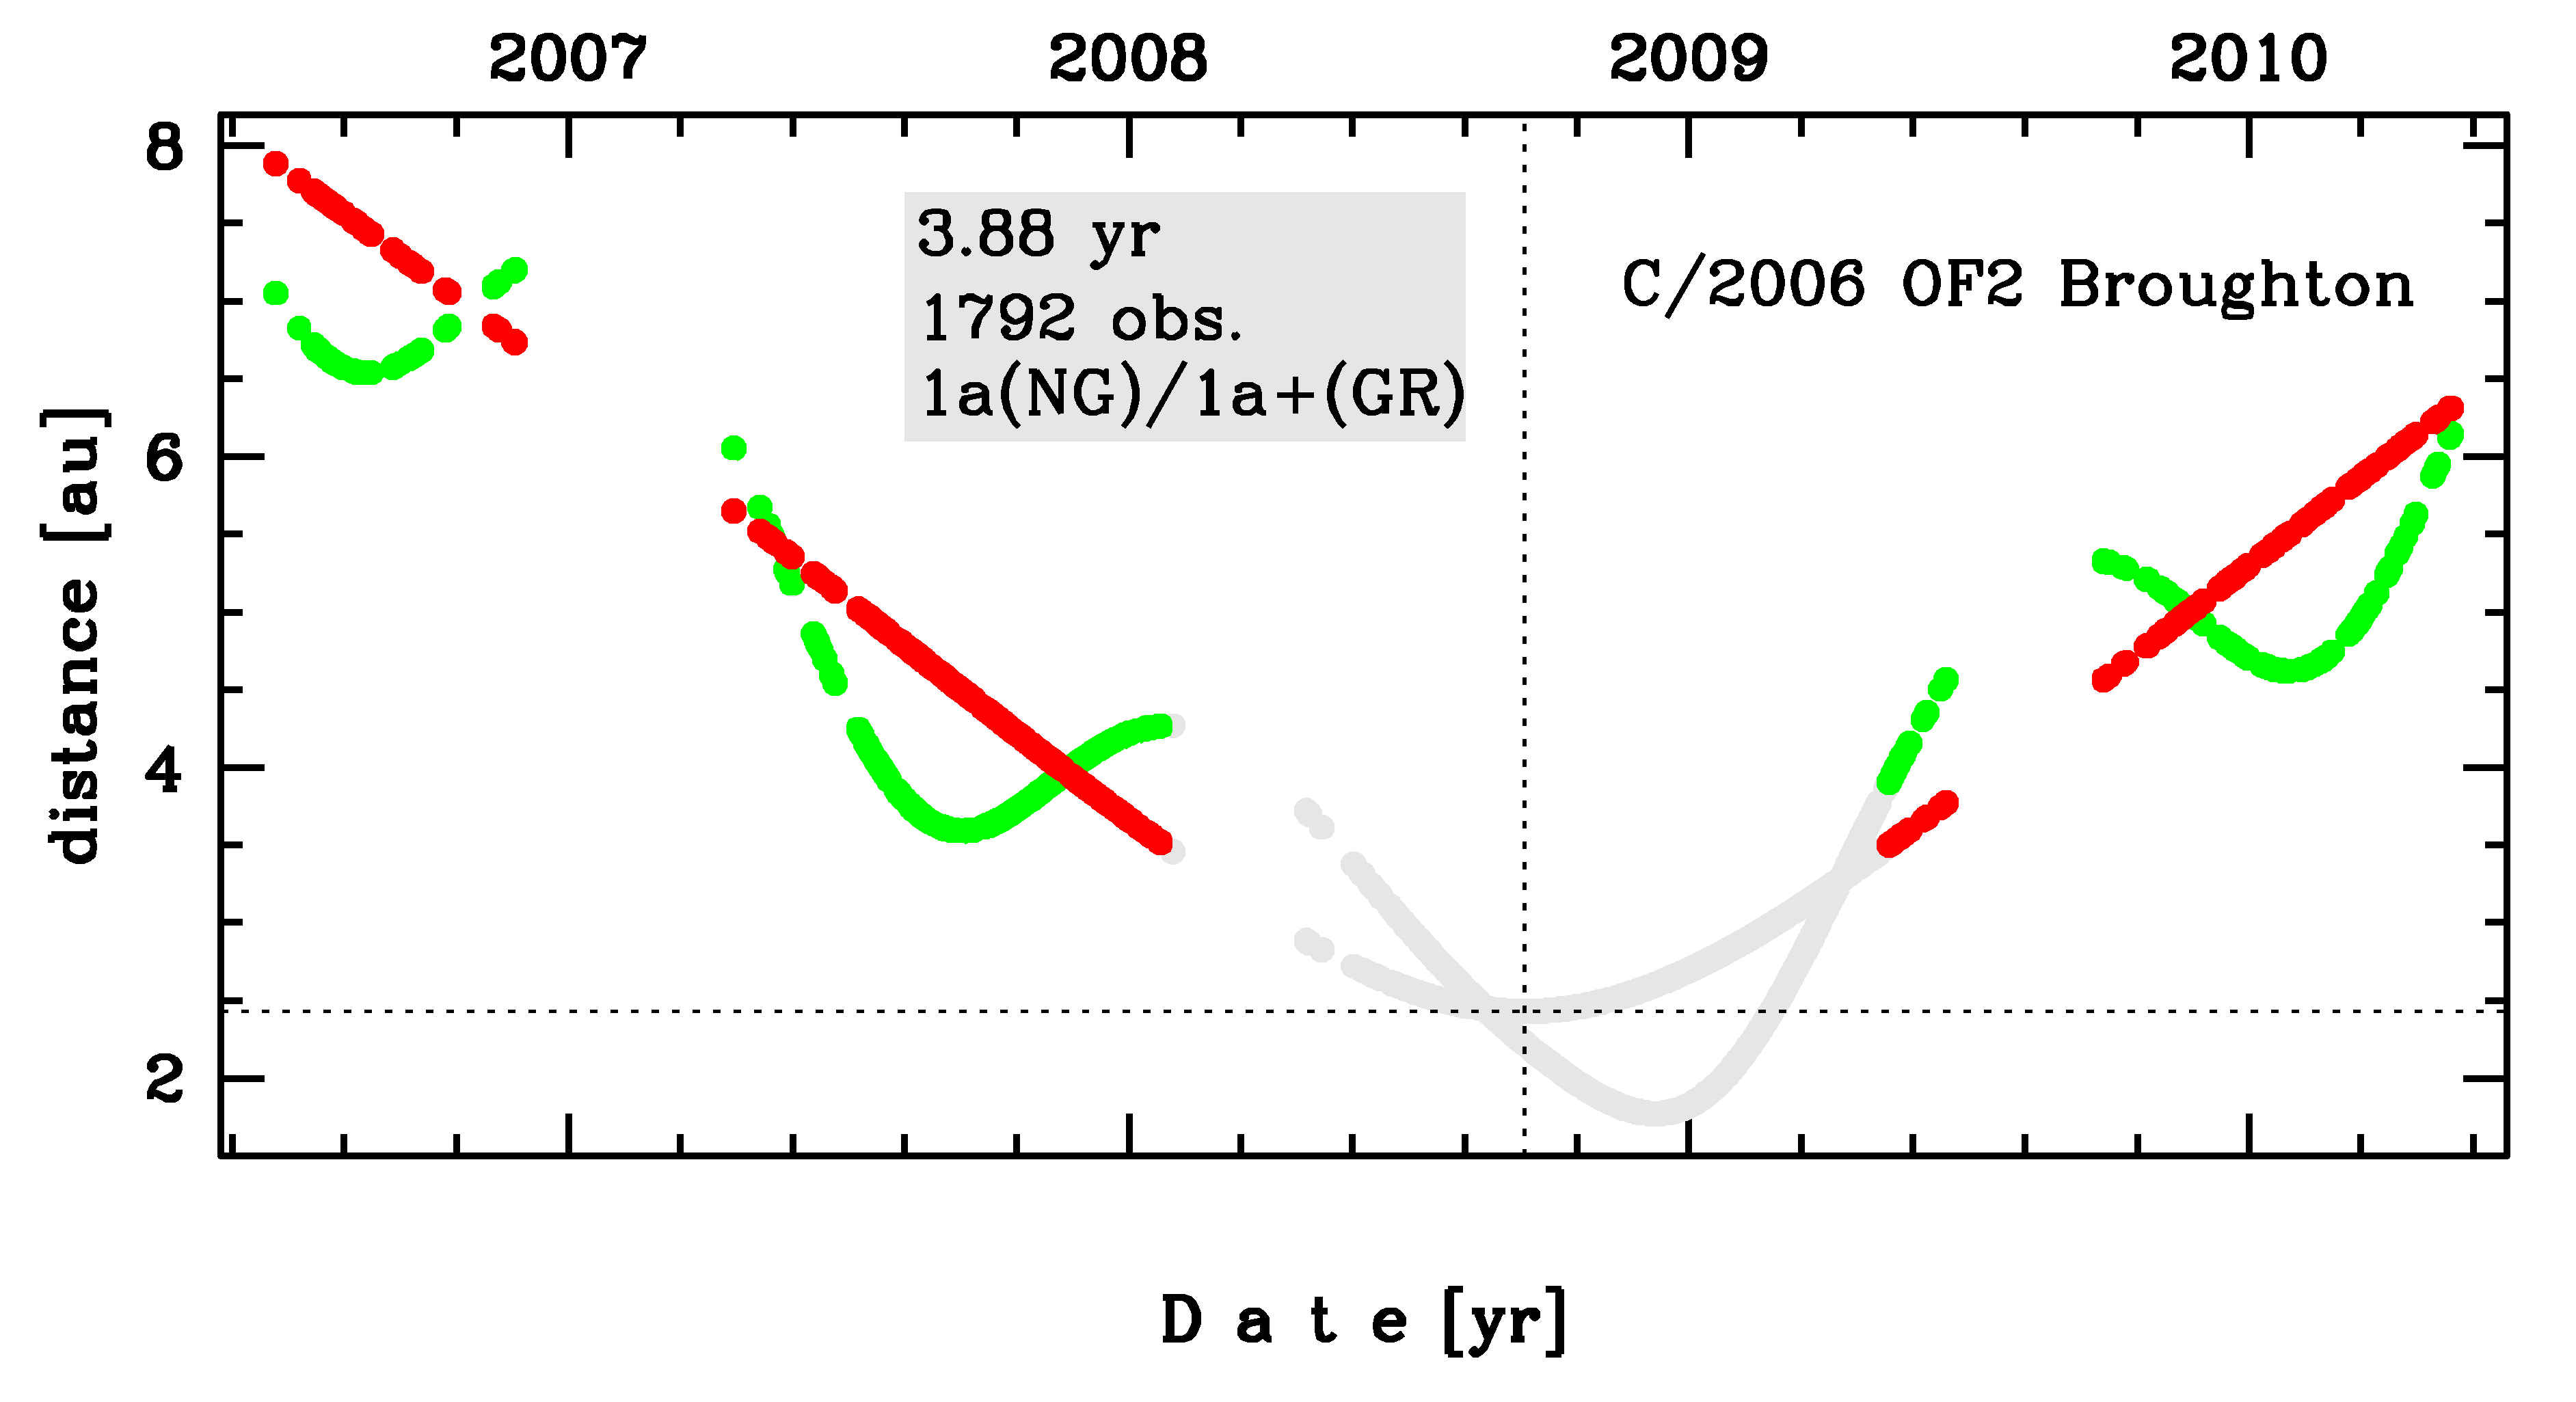
Time distribution of positional observations with corresponding heliocentric (red curve) and geocentric (green curve) distance at which they were taken. The horizontal dotted line shows the perihelion distance for a given comet whereas vertical dotted line — the moment of perihelion passage.
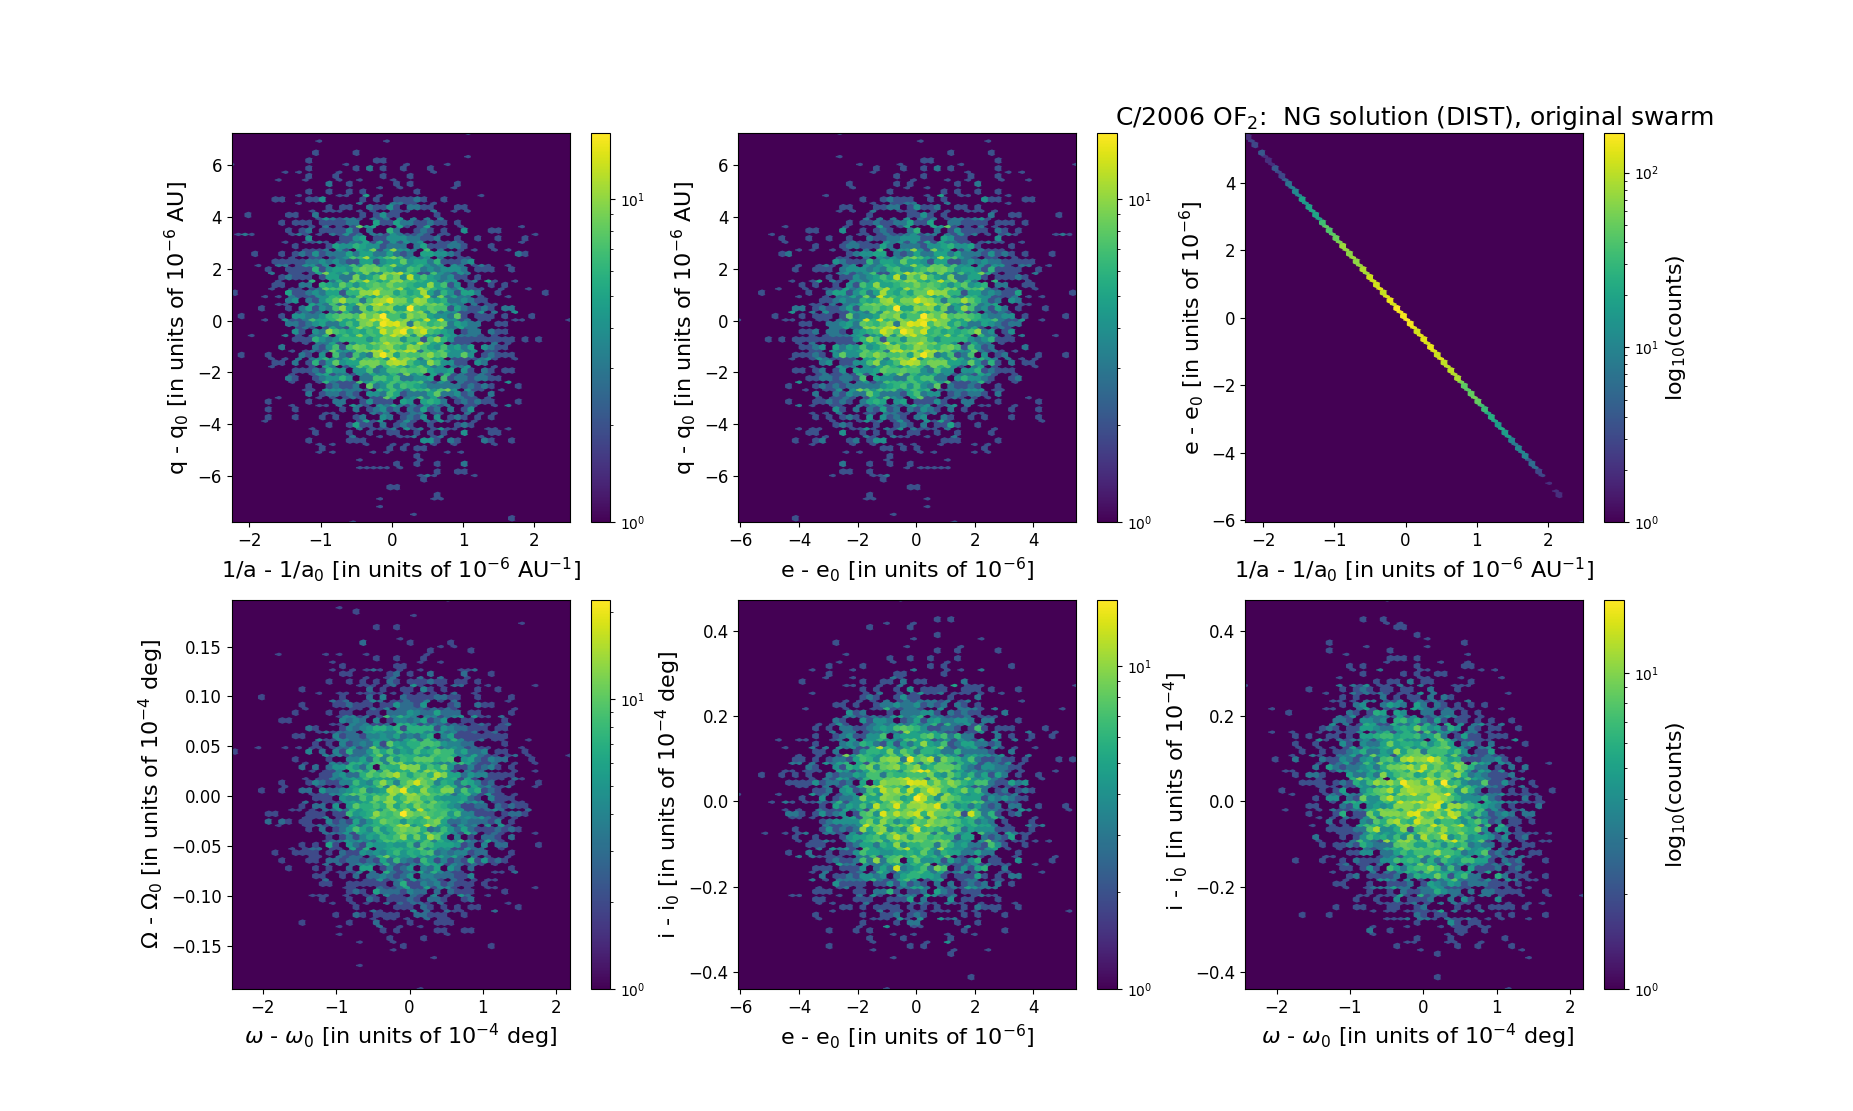
Six 2D-projections of the 6D space of original swarm including 5001 VCs. Each density map is given in logarithmic scale presented on the right in the individual panel.