C/2006 Q1 McNaught
more info
Comet C/2006 Q1 was discovered on 20 August 2006 by Robert H. McNaught (Siding Spring Survey); that is almost 2 years before its perihelion passage. It was observed systematically during four oppositions until 17 October 2010 (see picture).
Comet had its closest approach to the Earth on 8 April 2008 (2.241 au), about 3 months before its perihelion passage.
Preferred solution given here is based on data spanning over 4.16 yr in a range of heliocentric distances: 6.83 au – 2.764 au (perihelion) – 7.91 au.
This Oort spike comet suffers rather large planetary perturbations during its passage through the planetary system and these perturbations lead to more tight future orbit with semimajor axis of about 1,400 au (see future barycentric orbits).
See also Królikowska and Dybczyński 2013 and Królikowska 2020.
| solution description | ||
|---|---|---|
| number of observations | 2734 | |
| data interval | 2006 08 20 – 2010 10 17 | |
| data type | perihelion within the observation arc (FULL) | |
| data arc selection | entire data set (STD) | |
| range of heliocentric distances | 6.83 au – 2.76 au (perihelion) – 7.91 au | |
| type of model of motion | NT - non-gravitational orbits for asymmetric, standard g(r) | |
| data weighting | YES | |
| number of residuals | 5367 | |
| RMS [arcseconds] | 0.37 | |
| orbit quality class | 1a+ | |
| next orbit statistics, both Galactic and stellar perturbations were taken into account | ||
|---|---|---|
| no. of returning VCs in the swarm | 5001 | * |
| no. of escaping VCs in the swarm | 0 | |
| no. of hyperbolas among escaping VCs in the swarm | 0 | |
| next reciprocal semi-major axis [10-6 au-1] | 707.36 – 707.80 – 708.22 | |
| next perihelion distance [au] | 2.76025 – 2.76025 – 2.76025 | |
| next aphelion distance [103 au] | 2.8212 – 2.8229 – 2.8247 | |
| time interval to next perihelion [Myr] | 0.052716 – 0.052763 – 0.052811 | |
| percentage of VCs with qnext < 10 | 100 | |
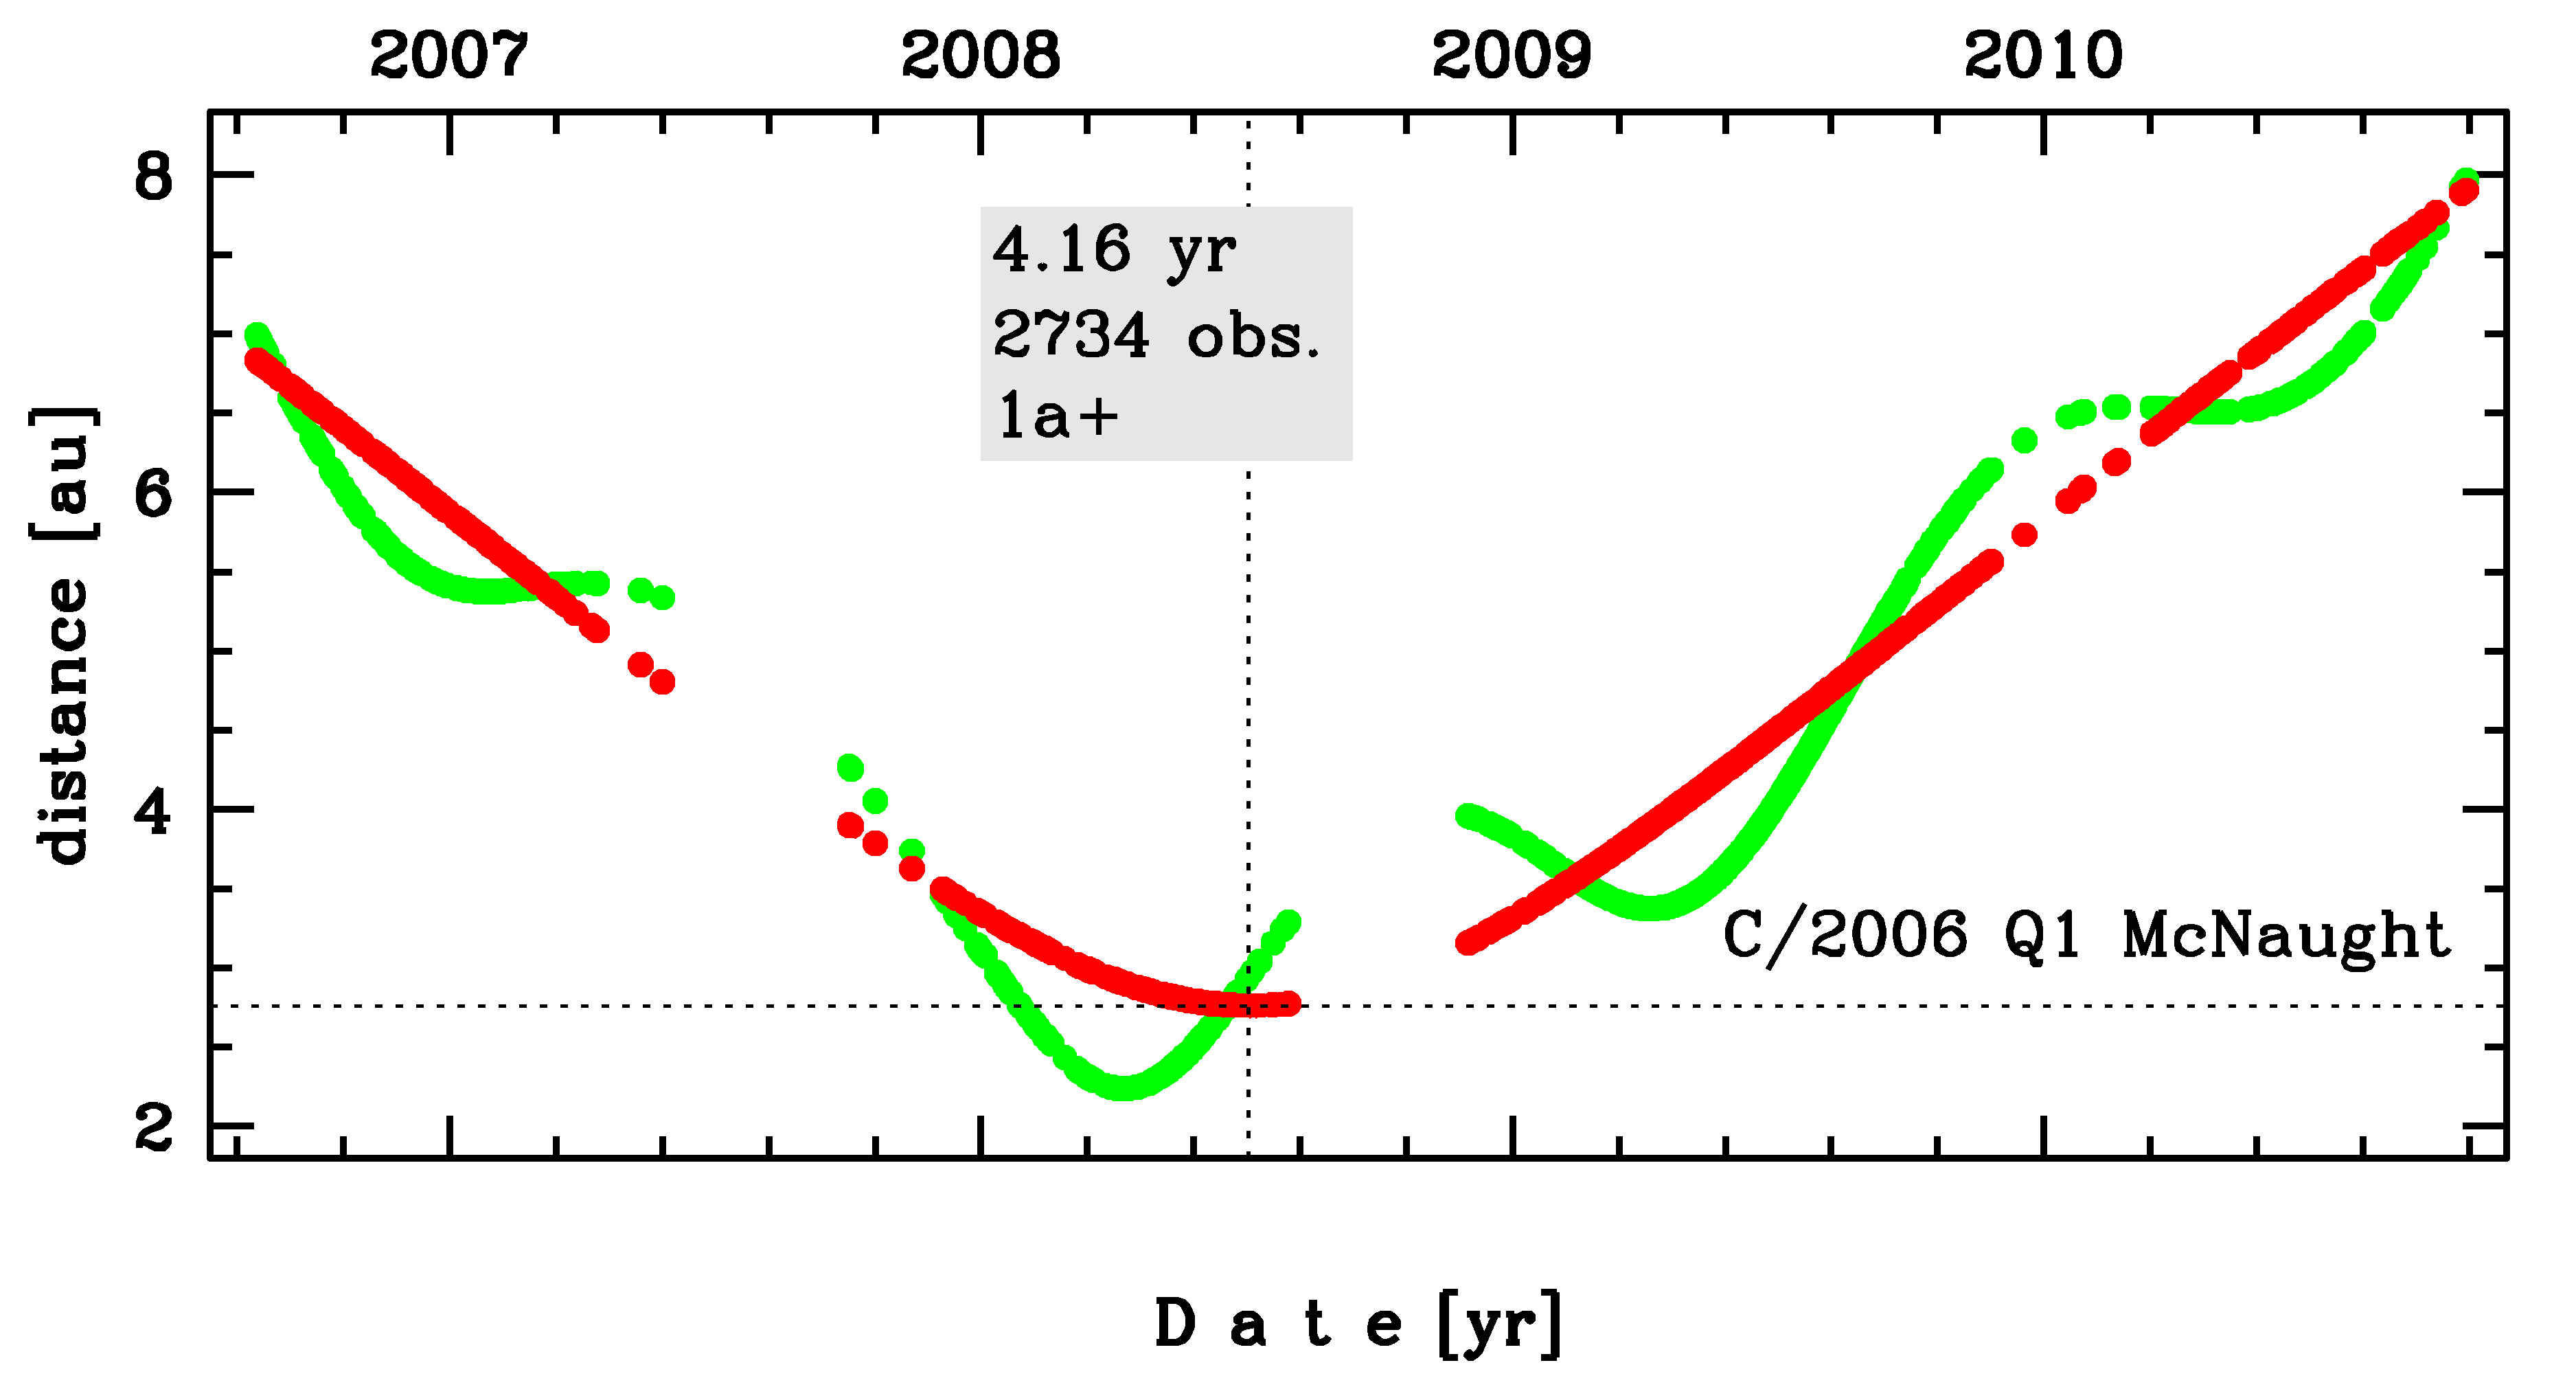
Time distribution of positional observations with corresponding heliocentric (red curve) and geocentric (green curve) distance at which they were taken. The horizontal dotted line shows the perihelion distance for a given comet whereas vertical dotted line — the moment of perihelion passage.
| next_g orbit statistics, here only the Galactic tide has been included | ||
|---|---|---|
| no. of returning VCs in the swarm | 5001 | * |
| no. of escaping VCs in the swarm | 0 | |
| no. of hyperbolas among escaping VCs in the swarm | 0 | |
| next reciprocal semi-major axis [10-6 au-1] | 707.36 – 707.79 – 708.22 | |
| next perihelion distance [au] | 2.75993 – 2.75993 – 2.75993 | |
| next aphelion distance [103 au] | 2.8212 – 2.8229 – 2.8247 | |
| time interval to next perihelion [Myr] | 0.052745 – 0.052793 – 0.052841 | |
| percentage of VCs with qnext < 10 | 100 | |