C/2006 S2 LINEAR
more info
C/2006 S2 was discovered on 17 September 2006 by the LINEAR as an apparently asteroidal object. Its cometary apperance was reported by J. Young on CCD images taken on 18 September with the Table Mountain 0.61-m f/16 reflector [IAUC 8750, 2006 September 19].
This comet made its closest approach to the Earth on 11 July 2007 (2.213 au), two months after perihelion (see figure).
Solutions given here are based on data spanning over 0.83 yr in a range of heliocentric distances: 3.86 au – 3.161 au (perihelion) – 3.23 au.
This Oort spike comet suffers slight planetary perturbations during its passage through the planetary system; however, they could lead to escape of the comet from the solar system on hiperbolic orbit (see future barycentric orbit in the case of non-gravitational solution).
See also Królikowska 2014 and Królikowska and Dybczyński 2017.
| solution description | ||
|---|---|---|
| number of observations | 178 | |
| data interval | 2006 09 17 – 2007 07 16 | |
| data type | perihelion within the observation arc (FULL) | |
| data arc selection | entire data set (STD) | |
| range of heliocentric distances | 3.86 au – 3.16 au (perihelion) – 3.23 au | |
| type of model of motion | NS - non-gravitational orbits for standard g(r) | |
| data weighting | YES | |
| number of residuals | 346 | |
| RMS [arcseconds] | 0.44 | |
| orbit quality class | 1b | |
| previous orbit statistics, both Galactic and stellar perturbations were taken into account | ||
|---|---|---|
| no. of returning VCs in the swarm | 5001 | * |
| no. of escaping VCs in the swarm | 0 | |
| no. of hyperbolas among escaping VCs in the swarm | 0 | |
| previous reciprocal semi-major axis [10-6 au-1] | 62.09 – 72.70 – 82.94 | |
| previous perihelion distance [au] | 3.02 – 3.06 – 3.19 | |
| previous aphelion distance [103 au] | 24 – 28 – 32 | |
| time interval to previous perihelion [Myr] | 1.3 – 1.6 – 2 | |
| percentage of VCs with qprev < 10 | 99 | |
| percentage of VCs with qprev > 20 | 1 | |
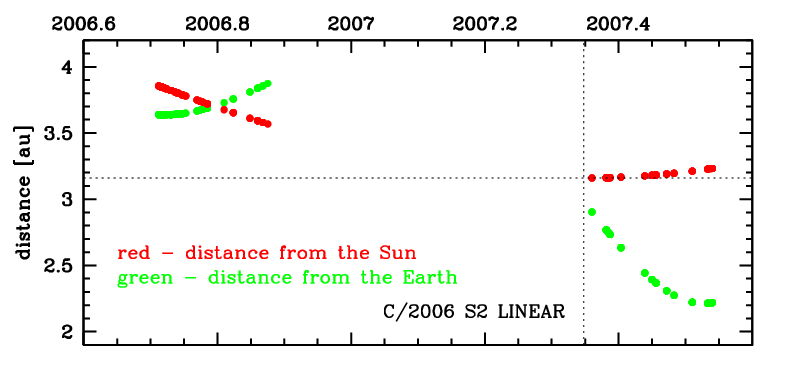
Time distribution of positional observations with corresponding heliocentric (red curve) and geocentric (green curve) distance at which they were taken. The horizontal dotted line shows the perihelion distance for a given comet whereas vertical dotted line — the moment of perihelion passage.
| previous_g orbit statistics, here only the Galactic tide has been included | ||
|---|---|---|
| no. of returning VCs in the swarm | 5001 | * |
| no. of escaping VCs in the swarm | 0 | |
| no. of hyperbolas among escaping VCs in the swarm | 0 | |
| previous reciprocal semi-major axis [10-6 au-1] | 62.11 – 72.71 – 82.92 | |
| previous perihelion distance [au] | 3.17 – 3.186 – 3.239 | |
| previous aphelion distance [103 au] | 24 – 28 – 32 | |
| time interval to previous perihelion [Myr] | 1.3 – 1.6 – 2 | |
| percentage of VCs with qprev < 10 | 100 | |