C/2006 VZ13 LINEAR
more info
Comet C/2006 VZ13 was discovered on 13 November 2006 with Lincoln Laboratory Near-Earth Asteroid Research project; that is 9 months before its perihelion passage. In the early images this object has stellar appearance; however, soon a weak coma was detected. Observations have stopped 4 days after perihelion passage at the distance of 1.02 au from the Sun.
Comet had its closest approach to the Earth on 14 July 2007 (0.575 au), about 3.5 weeks before its perihelion passage.
Preferred solution given here is based on pre-perihelion data taken before 1 July 2007 and spanning over 0.751 yr in a range of heliocentric distances from 3.84 au to 1.23 au; with such a data limitation it was possible to derive the non-gravitational osculating orbit that gives O-C diagram free from trends in right ascension and declination.
This Oort spike comet was lost soon after perihelion; however, the future orbits for solutions based on entire data set (a5, n5, n6) are given here.
See also Królikowska and Dybczyński 2013 and Królikowska 2020.
| solution description | ||
|---|---|---|
| number of observations | 419 | |
| data interval | 2006 11 13 – 2007 06 30 | |
| data arc selection | data generally limited to pre-perihelion (PRE) | |
| range of heliocentric distances | 3.84 au – 1.23au | |
| type of model of motion | NS - non-gravitational orbits for standard g(r) | |
| data weighting | YES | |
| number of residuals | 823 | |
| RMS [arcseconds] | 0.39 | |
| orbit quality class | 2a | |
| orbital elements (barycentric ecliptic J2000) | ||
|---|---|---|
| Epoch | 1709 04 12 | |
| perihelion date | 2007 08 11.24724054 | ± 0.00068795 |
| perihelion distance [au] | 1.01301057 | ± 0.00000132 |
| eccentricity | 0.99998585 | ± 0.00000486 |
| argument of perihelion [°] | 174.164610 | ± 0.000185 |
| ascending node [°] | 65.978852 | ± 0.000093 |
| inclination [°] | 134.779701 | ± 0.000041 |
| reciprocal semi-major axis [10-6 au-1] | 13.96 | ± 4.80 |
| file containing 5001 VCs swarm |
|---|
| 2006vzp2.bmi |
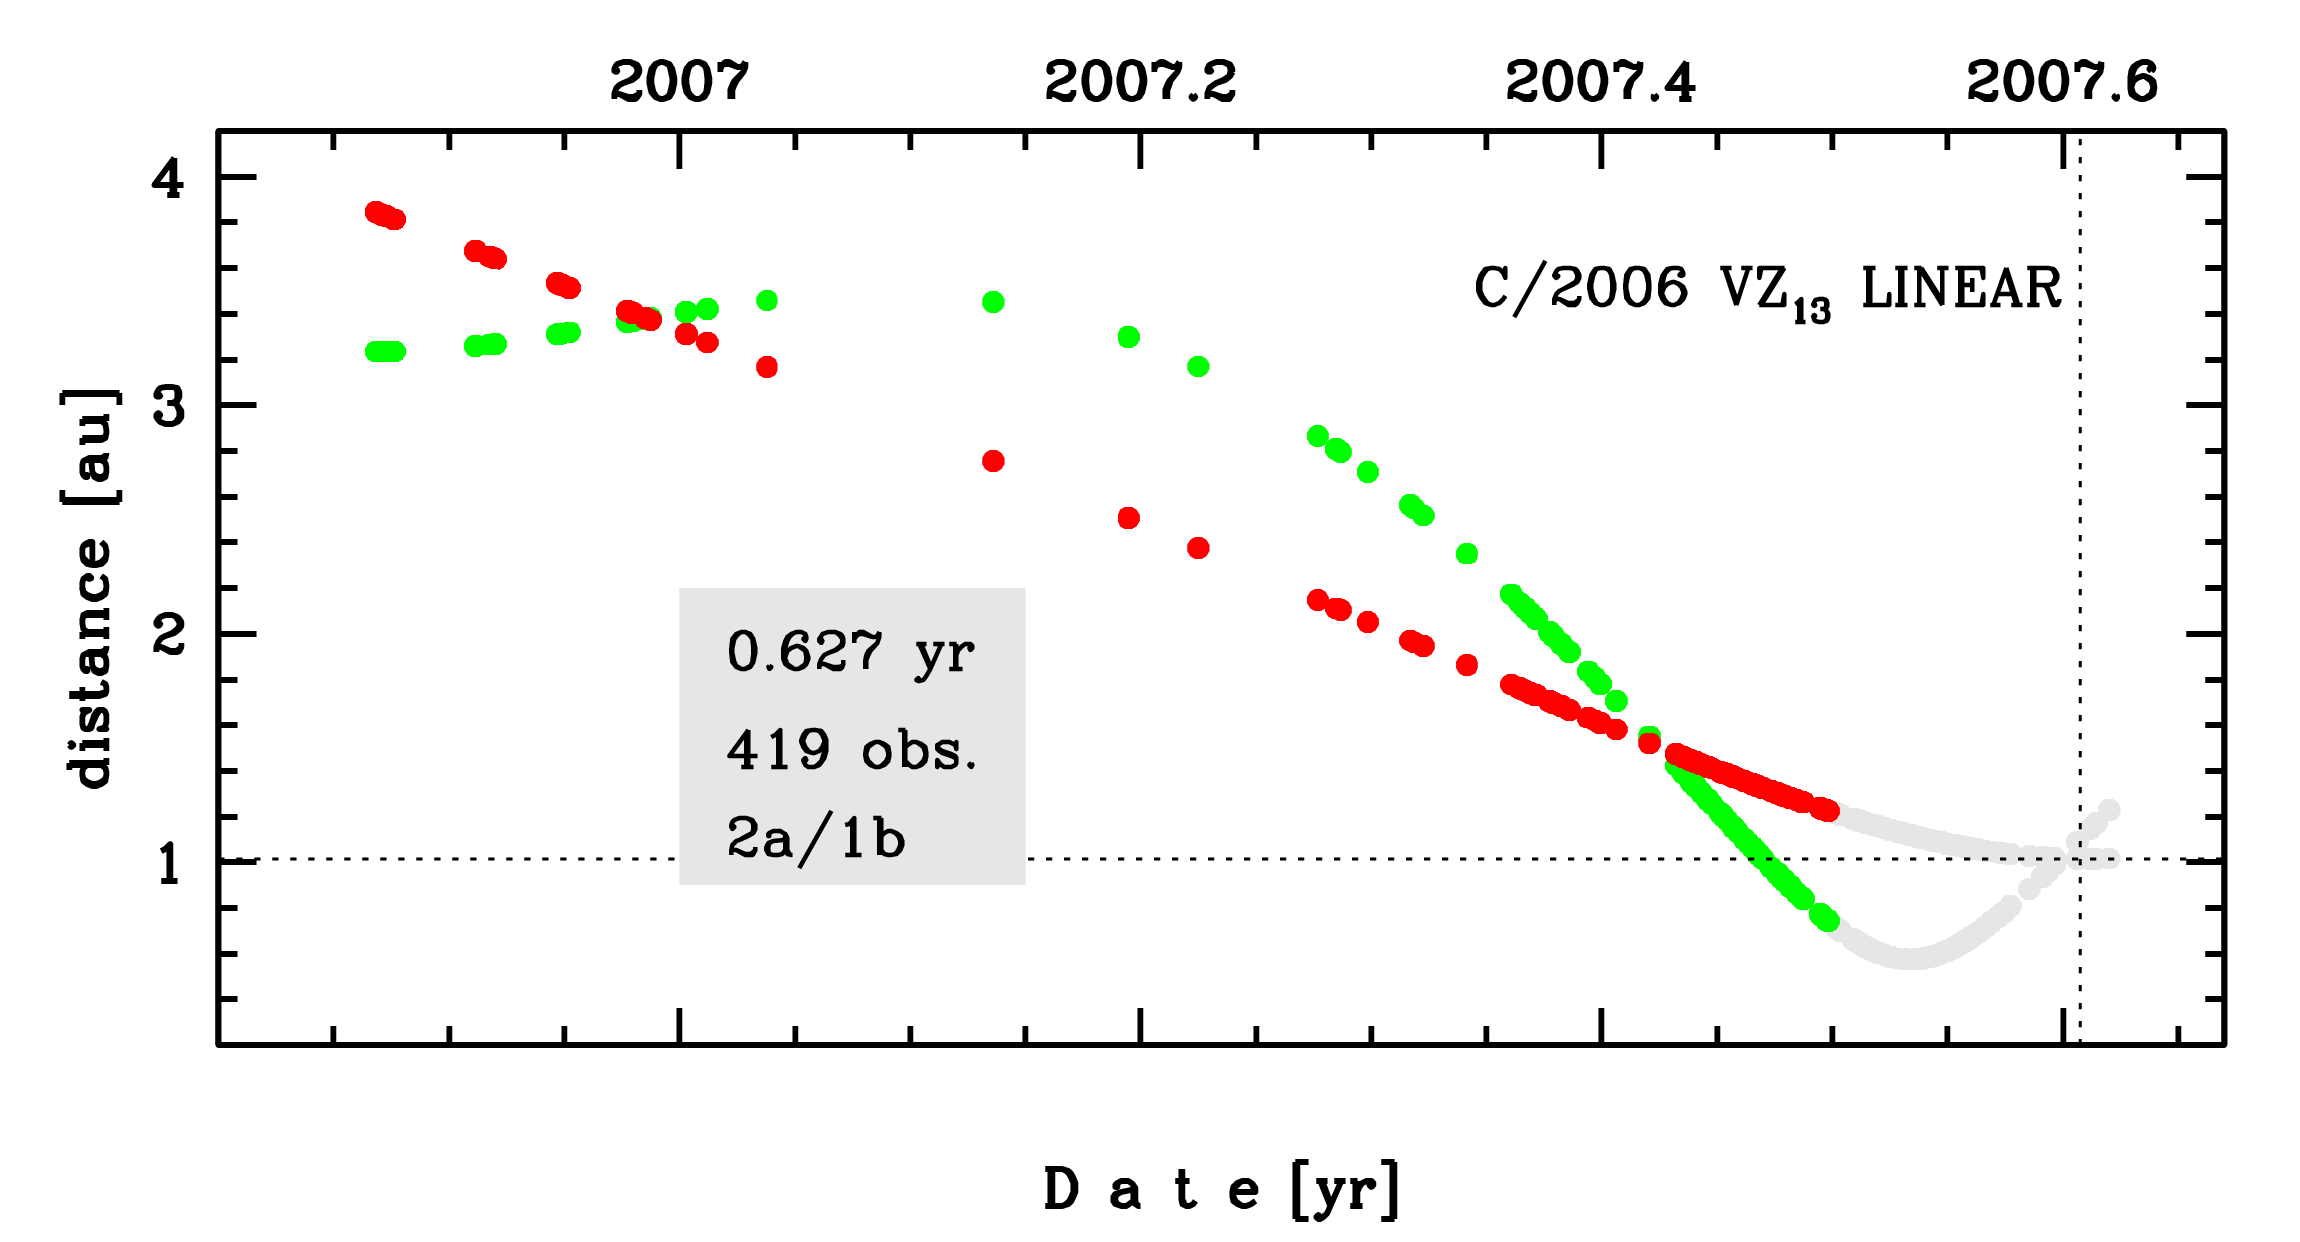
Time distribution of positional observations with corresponding heliocentric (red curve) and geocentric (green curve) distance at which they were taken. The horizontal dotted line shows the perihelion distance for a given comet whereas vertical dotted line — the moment of perihelion passage.
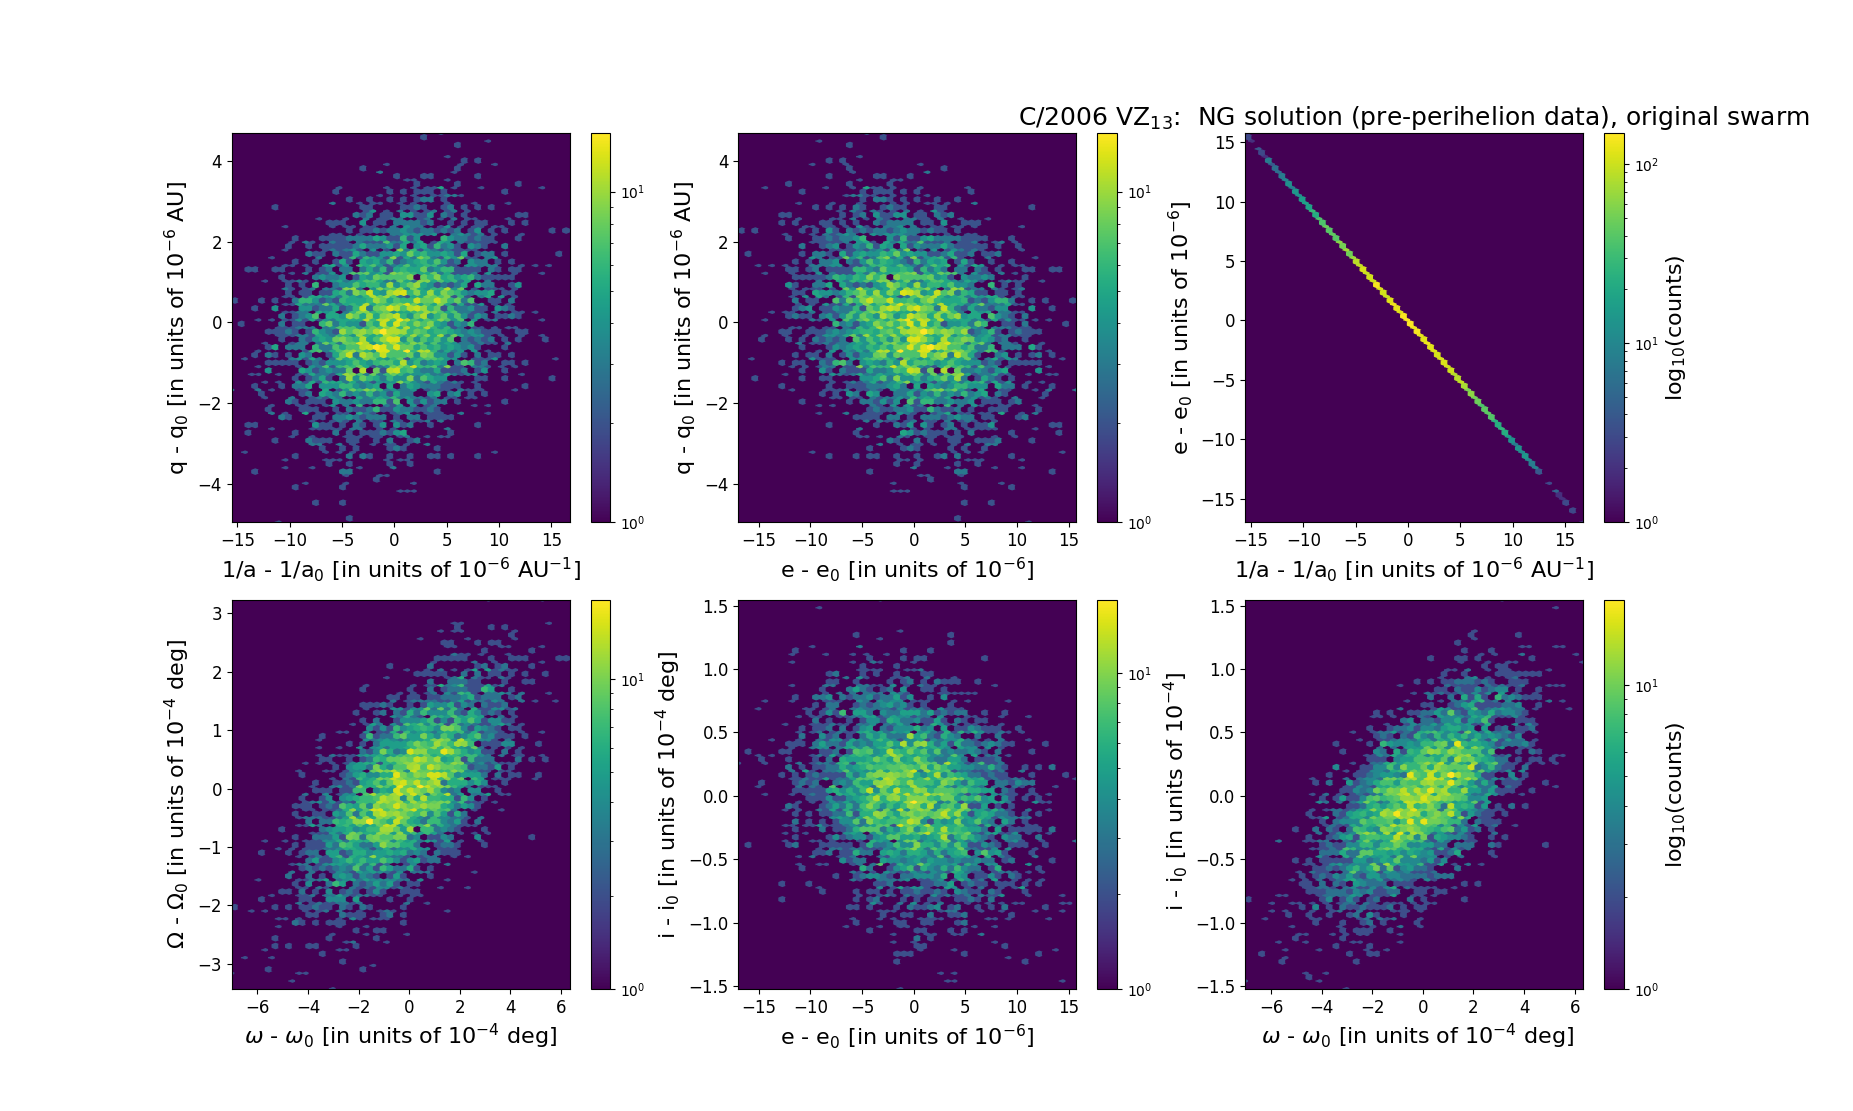
Six 2D-projections of the 6D space of original swarm including 5001 VCs. Each density map is given in logarithmic scale presented on the right in the individual panel.