C/2007 N3 Lulin
more info
Comet C/2007 N3 was discovered on 11 July 2007 with Lulin Sky Survey (Taiwan); that is about 1.5 years before its perihelion passage. It was observed until 1 January 2011 (see picture).
Comet had its closest approach to the Earth on 24 February 2009 (0.411 au), about 1.5 month after its perihelion passage.
Preferred solution given here is based on data spanning over 3.48 yr in a range of heliocentric distances: 6.38 au – 1.212 au (perihelion) – 7.82 au.
This Oort spike comet suffers rather large planetary perturbations during its passage through the planetary system and these perturbations lead to more tight future orbit with semimajor axis of about 1,200 au (see future barycentric orbits).
For more details see Królikowska and Dybczyński 2013 and Królikowska 2020.
| solution description | ||
|---|---|---|
| number of observations | 3928 | |
| data interval | 2007 07 11 – 2011 01 01 | |
| data type | perihelion within the observation arc (FULL) | |
| data arc selection | entire data set (STD) | |
| range of heliocentric distances | 6.38 au – 1.21 au (perihelion) – 7.82 au | |
| detectability of NG effects in the comet's motion | comet with NG effects strongly manifested in positional data fitting | |
| type of model of motion | GR - gravitational orbit | |
| data weighting | YES | |
| number of residuals | 7752 | |
| RMS [arcseconds] | 0.50 | |
| orbit quality class | 1a+ | |
| next orbit statistics, both Galactic and stellar perturbations were taken into account | ||
|---|---|---|
| no. of returning VCs in the swarm | 5001 | * |
| no. of escaping VCs in the swarm | 0 | |
| no. of hyperbolas among escaping VCs in the swarm | 0 | |
| next reciprocal semi-major axis [10-6 au-1] | 826.36 – 826.51 – 826.66 | |
| next perihelion distance [au] | 1.21575 – 1.21575 – 1.21575 | |
| next aphelion distance [103 au] | 2.4182 – 2.4186 – 2.419 | |
| time interval to next perihelion [Myr] | 0.041768 – 0.041779 – 0.04179 | |
| percentage of VCs with qnext < 10 | 100 | |
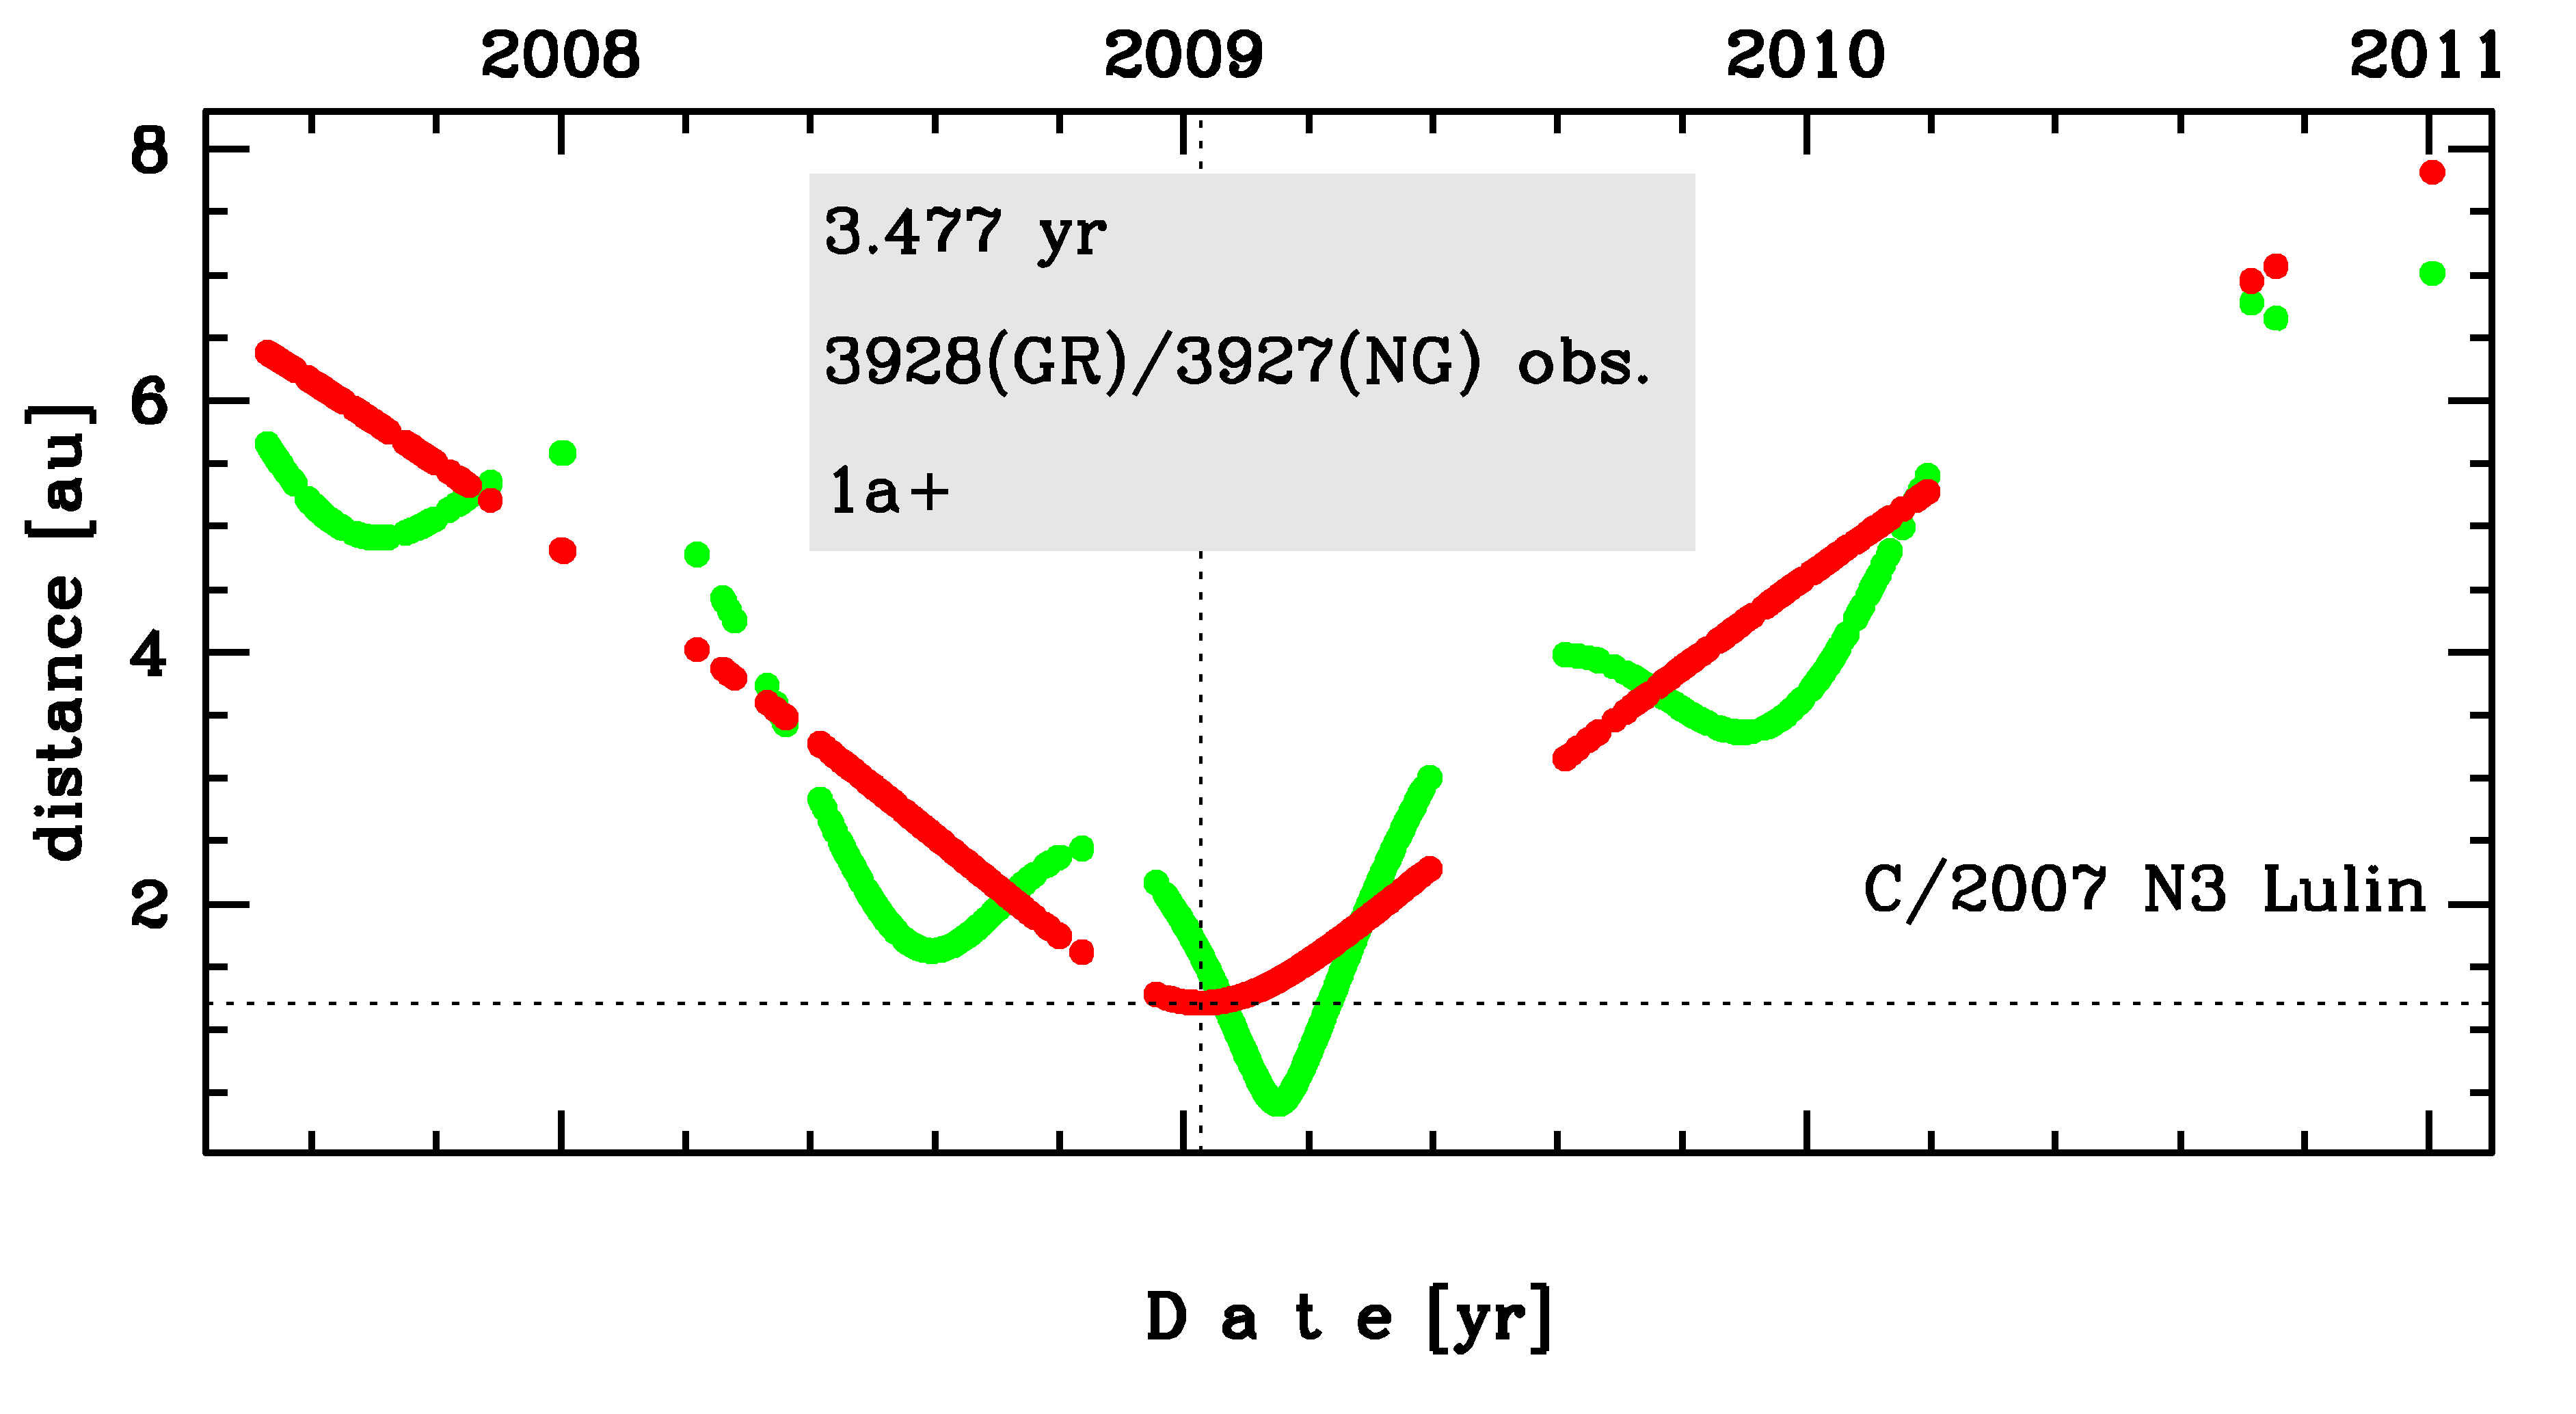
Time distribution of positional observations with corresponding heliocentric (red curve) and geocentric (green curve) distance at which they were taken. The horizontal dotted line shows the perihelion distance for a given comet whereas vertical dotted line — the moment of perihelion passage.
| next_g orbit statistics, here only the Galactic tide has been included | ||
|---|---|---|
| no. of returning VCs in the swarm | 5001 | * |
| no. of escaping VCs in the swarm | 0 | |
| no. of hyperbolas among escaping VCs in the swarm | 0 | |
| next reciprocal semi-major axis [10-6 au-1] | 826.36 – 826.51 – 826.66 | |
| next perihelion distance [au] | 1.215 – 1.215 – 1.215 | |
| next aphelion distance [103 au] | 2.4182 – 2.4186 – 2.419 | |
| time interval to next perihelion [Myr] | 0.041768 – 0.041779 – 0.041791 | |
| percentage of VCs with qnext < 10 | 100 | |