C/2007 W3 LINEAR
more info
Comet C/2007 W3 was discovered on 29 November 2007 with Lincoln Laboratory Near-Earth Asteroid Research project; that is about 6 months before its perihelion passage. It was observed until 8 September 2008.
Comet had its closest approach to the Earth on 27 June 2008 (1.576 au), about 3.5 weeks after its perihelion passage.
Solutions given here are based on data spanning over 0.775 yr in a range of heliocentric distances: 2.89 au – 1.777 au (perihelion) – 2.17 au, and the non-gravitational acceleration is well-detectable in its motion during the period covered by positional observations (about nine months).
This Oort spike comet suffers moderate planetary perturbations during its passage through the planetary system and these perturbations lead to a more tight future orbit (see future barycentric orbit).
See also Królikowska and Dybczyński 2013 and Królikowska 2020.
| solution description | ||
|---|---|---|
| number of observations | 208 | |
| data interval | 2007 11 29 – 2008 09 08 | |
| data type | significantly more measurements before perihelion (PRE+) | |
| data arc selection | entire data set (STD) | |
| range of heliocentric distances | 2.89 au – 1.78 au (perihelion) – 2.17 au | |
| type of model of motion | NS - non-gravitational orbits for standard g(r) | |
| data weighting | YES | |
| number of residuals | 413 | |
| RMS [arcseconds] | 0.52 | |
| orbit quality class | 1b | |
| next orbit statistics, both Galactic and stellar perturbations were taken into account | ||
|---|---|---|
| no. of returning VCs in the swarm | 5001 | * |
| no. of escaping VCs in the swarm | 0 | |
| no. of hyperbolas among escaping VCs in the swarm | 0 | |
| next reciprocal semi-major axis [10-6 au-1] | 321.21 – 344.20 – 367.69 | |
| next perihelion distance [au] | 1.7713 – 1.7715 – 1.7717 | |
| next aphelion distance [103 au] | 5.44 – 5.81 – 6.22 | |
| time interval to next perihelion [Myr] | 0.141 – 0.156 – 0.173 | |
| percentage of VCs with qnext < 10 | 100 | |
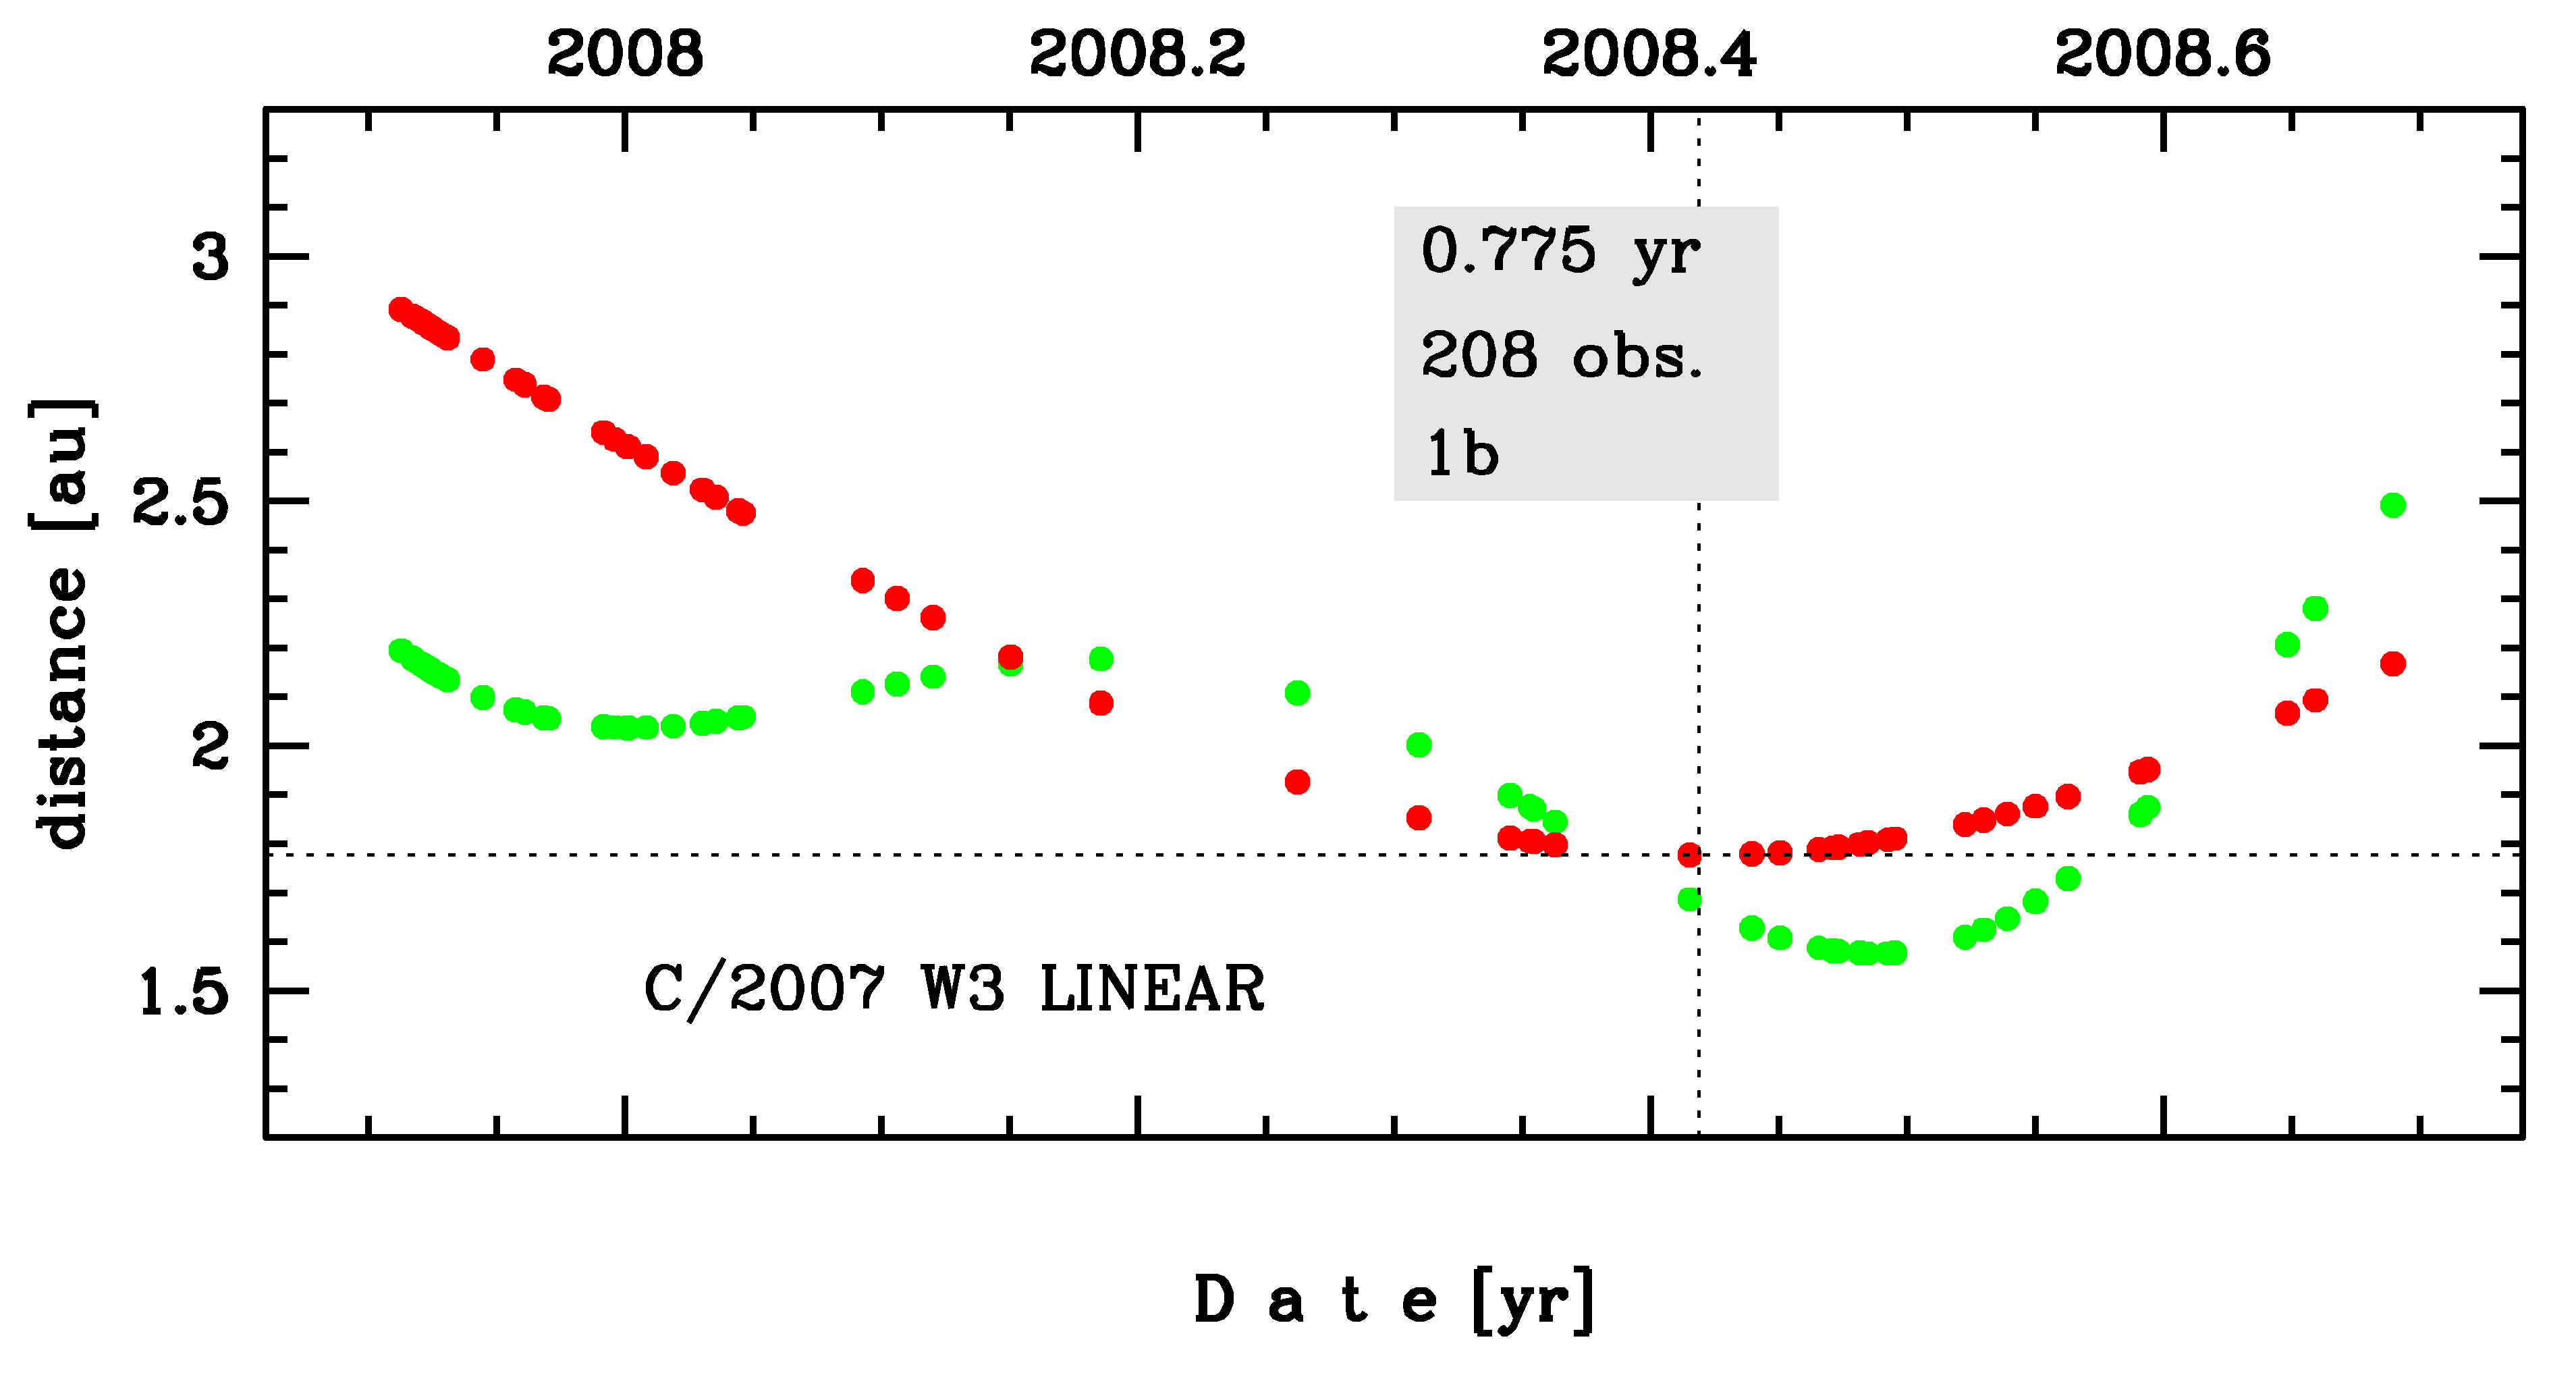
Time distribution of positional observations with corresponding heliocentric (red curve) and geocentric (green curve) distance at which they were taken. The horizontal dotted line shows the perihelion distance for a given comet whereas vertical dotted line — the moment of perihelion passage.
| next_g orbit statistics, here only the Galactic tide has been included | ||
|---|---|---|
| no. of returning VCs in the swarm | 5001 | * |
| no. of escaping VCs in the swarm | 0 | |
| no. of hyperbolas among escaping VCs in the swarm | 0 | |
| next reciprocal semi-major axis [10-6 au-1] | 321.22 – 344.20 – 367.70 | |
| next perihelion distance [au] | 1.77028 – 1.77039 – 1.77052 | |
| next aphelion distance [103 au] | 5.44 – 5.81 – 6.22 | |
| time interval to next perihelion [Myr] | 0.141 – 0.156 – 0.173 | |
| percentage of VCs with qnext < 10 | 100 | |