C/2007 Y1 LINEAR
more info
C/2007 Y1 was discovered on 16 December 2007 by the LINEAR as an apparently asteroidal object. Next, its cometary apperance was reported by several observers [IAUC 8904, 2007 December 18].
This comet made its closest approaches to the Earth on 10 February 2008 (2.402 au), 1.3 month before perihelion (see figure).
Solution given here is based on data spanning over 0.38 yr in a narrow range of heliocentric distances: 3.46 au – 3.341 au (perihelion) – 3.37 au.
This Oort spike comet suffers rather small planetary perturbations during its passage through the planetary system that lead to a more tight future orbit (see future barycentric orbit).
See also Królikowska 2014 and Królikowska and Dybczyński 2017.
| solution description | ||
|---|---|---|
| number of observations | 209 | |
| data interval | 2007 12 16 – 2008 05 03 | |
| data type | perihelion within the observation arc (FULL) | |
| data arc selection | entire data set (STD) | |
| range of heliocentric distances | 3.46 au – 3.34 au (perihelion) – 3.37 au | |
| detectability of NG effects in the comet's motion | NG effects not determinable | |
| type of model of motion | GR - gravitational orbit | |
| data weighting | YES | |
| number of residuals | 415 | |
| RMS [arcseconds] | 0.61 | |
| orbit quality class | 2a | |
| next orbit statistics, both Galactic and stellar perturbations were taken into account | ||
|---|---|---|
| no. of returning VCs in the swarm | 5001 | * |
| no. of escaping VCs in the swarm | 0 | |
| no. of hyperbolas among escaping VCs in the swarm | 0 | |
| next reciprocal semi-major axis [10-6 au-1] | 268.39 – 284.20 – 300.59 | |
| next perihelion distance [au] | 3.33514 – 3.33545 – 3.33574 | |
| next aphelion distance [103 au] | 6.65 – 7.03 – 7.45 | |
| time interval to next perihelion [Myr] | 0.191 – 0.208 – 0.227 | |
| percentage of VCs with qnext < 10 | 100 | |
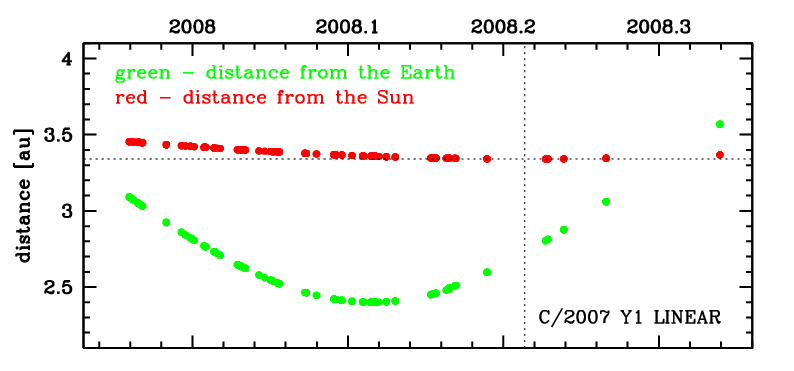
Time distribution of positional observations with corresponding heliocentric (red curve) and geocentric (green curve) distance at which they were taken. The horizontal dotted line shows the perihelion distance for a given comet whereas vertical dotted line — the moment of perihelion passage.
| next_g orbit statistics, here only the Galactic tide has been included | ||
|---|---|---|
| no. of returning VCs in the swarm | 5001 | * |
| no. of escaping VCs in the swarm | 0 | |
| no. of hyperbolas among escaping VCs in the swarm | 0 | |
| next reciprocal semi-major axis [10-6 au-1] | 268.39 – 284.20 – 300.59 | |
| next perihelion distance [au] | 3.34215 – 3.34232 – 3.34245 | |
| next aphelion distance [103 au] | 6.65 – 7.03 – 7.45 | |
| time interval to next perihelion [Myr] | 0.191 – 0.208 – 0.227 | |
| percentage of VCs with qnext < 10 | 100 | |