C/2009 K5 McNaught
more info
Comet C/2009 K5 was discovered on 27 May 2009 by Robert H. McNaught (Siding Spring); that is about 11 months before its perihelion passage. The comet was observed until 26 October 2011.
Comet had its closest approach to the Earth on 18 April 2010 (1.264 au), 12 days before its perihelion passage.
Some trends in O-C time variations in the pure gravitational model based on entire data set were noticed, unfortunately, the NG effects cannot be reliably determined for this comet.
Preferred solution given here is based on data taken at large perihelion distances and spanning over 2.50 yr in a range of heliocentric distances: 4.35 au – 1.422 au (perihelion) – 6.49 au; however, two separate gravitational osculating orbits based on pre-perihelion (solution pa) and post-perihelion data (ra) are also presented.
This Oort spike comet suffers moderate planetary perturbations during its passage through the planetary system; these perturbations lead to a more tight future orbit (see future barycentric orbits).
See also Królikowska and Dybczyński 2013 and Królikowska 2020.
| solution description | ||
|---|---|---|
| number of observations | 894 | |
| data interval | 2009 05 27 – 2011 11 26 | |
| data arc selection | only data taken in large heliocentric distance (DIS) | |
| range of heliocentric distances | 4.35 au – 1.42 au (perihelion) – 6.49 au | |
| detectability of NG effects in the comet's motion | NG effects not determinable | |
| type of model of motion | GR - gravitational orbit | |
| data weighting | YES | |
| number of residuals | 1727 | |
| RMS [arcseconds] | 0.36 | |
| orbit quality class | 1a | |
| orbital elements (barycentric ecliptic J2000) | ||
|---|---|---|
| Epoch | 1710 12 03 | |
| perihelion date | 2010 04 28.96850889 | ± 0.00006246 |
| perihelion distance [au] | 1.41933165 | ± 0.00000018 |
| eccentricity | 0.99993471 | ± 0.00000038 |
| argument of perihelion [°] | 66.205146 | ± 0.000009 |
| ascending node [°] | 257.740102 | ± 0.000006 |
| inclination [°] | 103.924816 | ± 0.000012 |
| reciprocal semi-major axis [10-6 au-1] | 46.00 | ± 0.26 |
| file containing 5001 VCs swarm |
|---|
| 2009k5da.bmi |
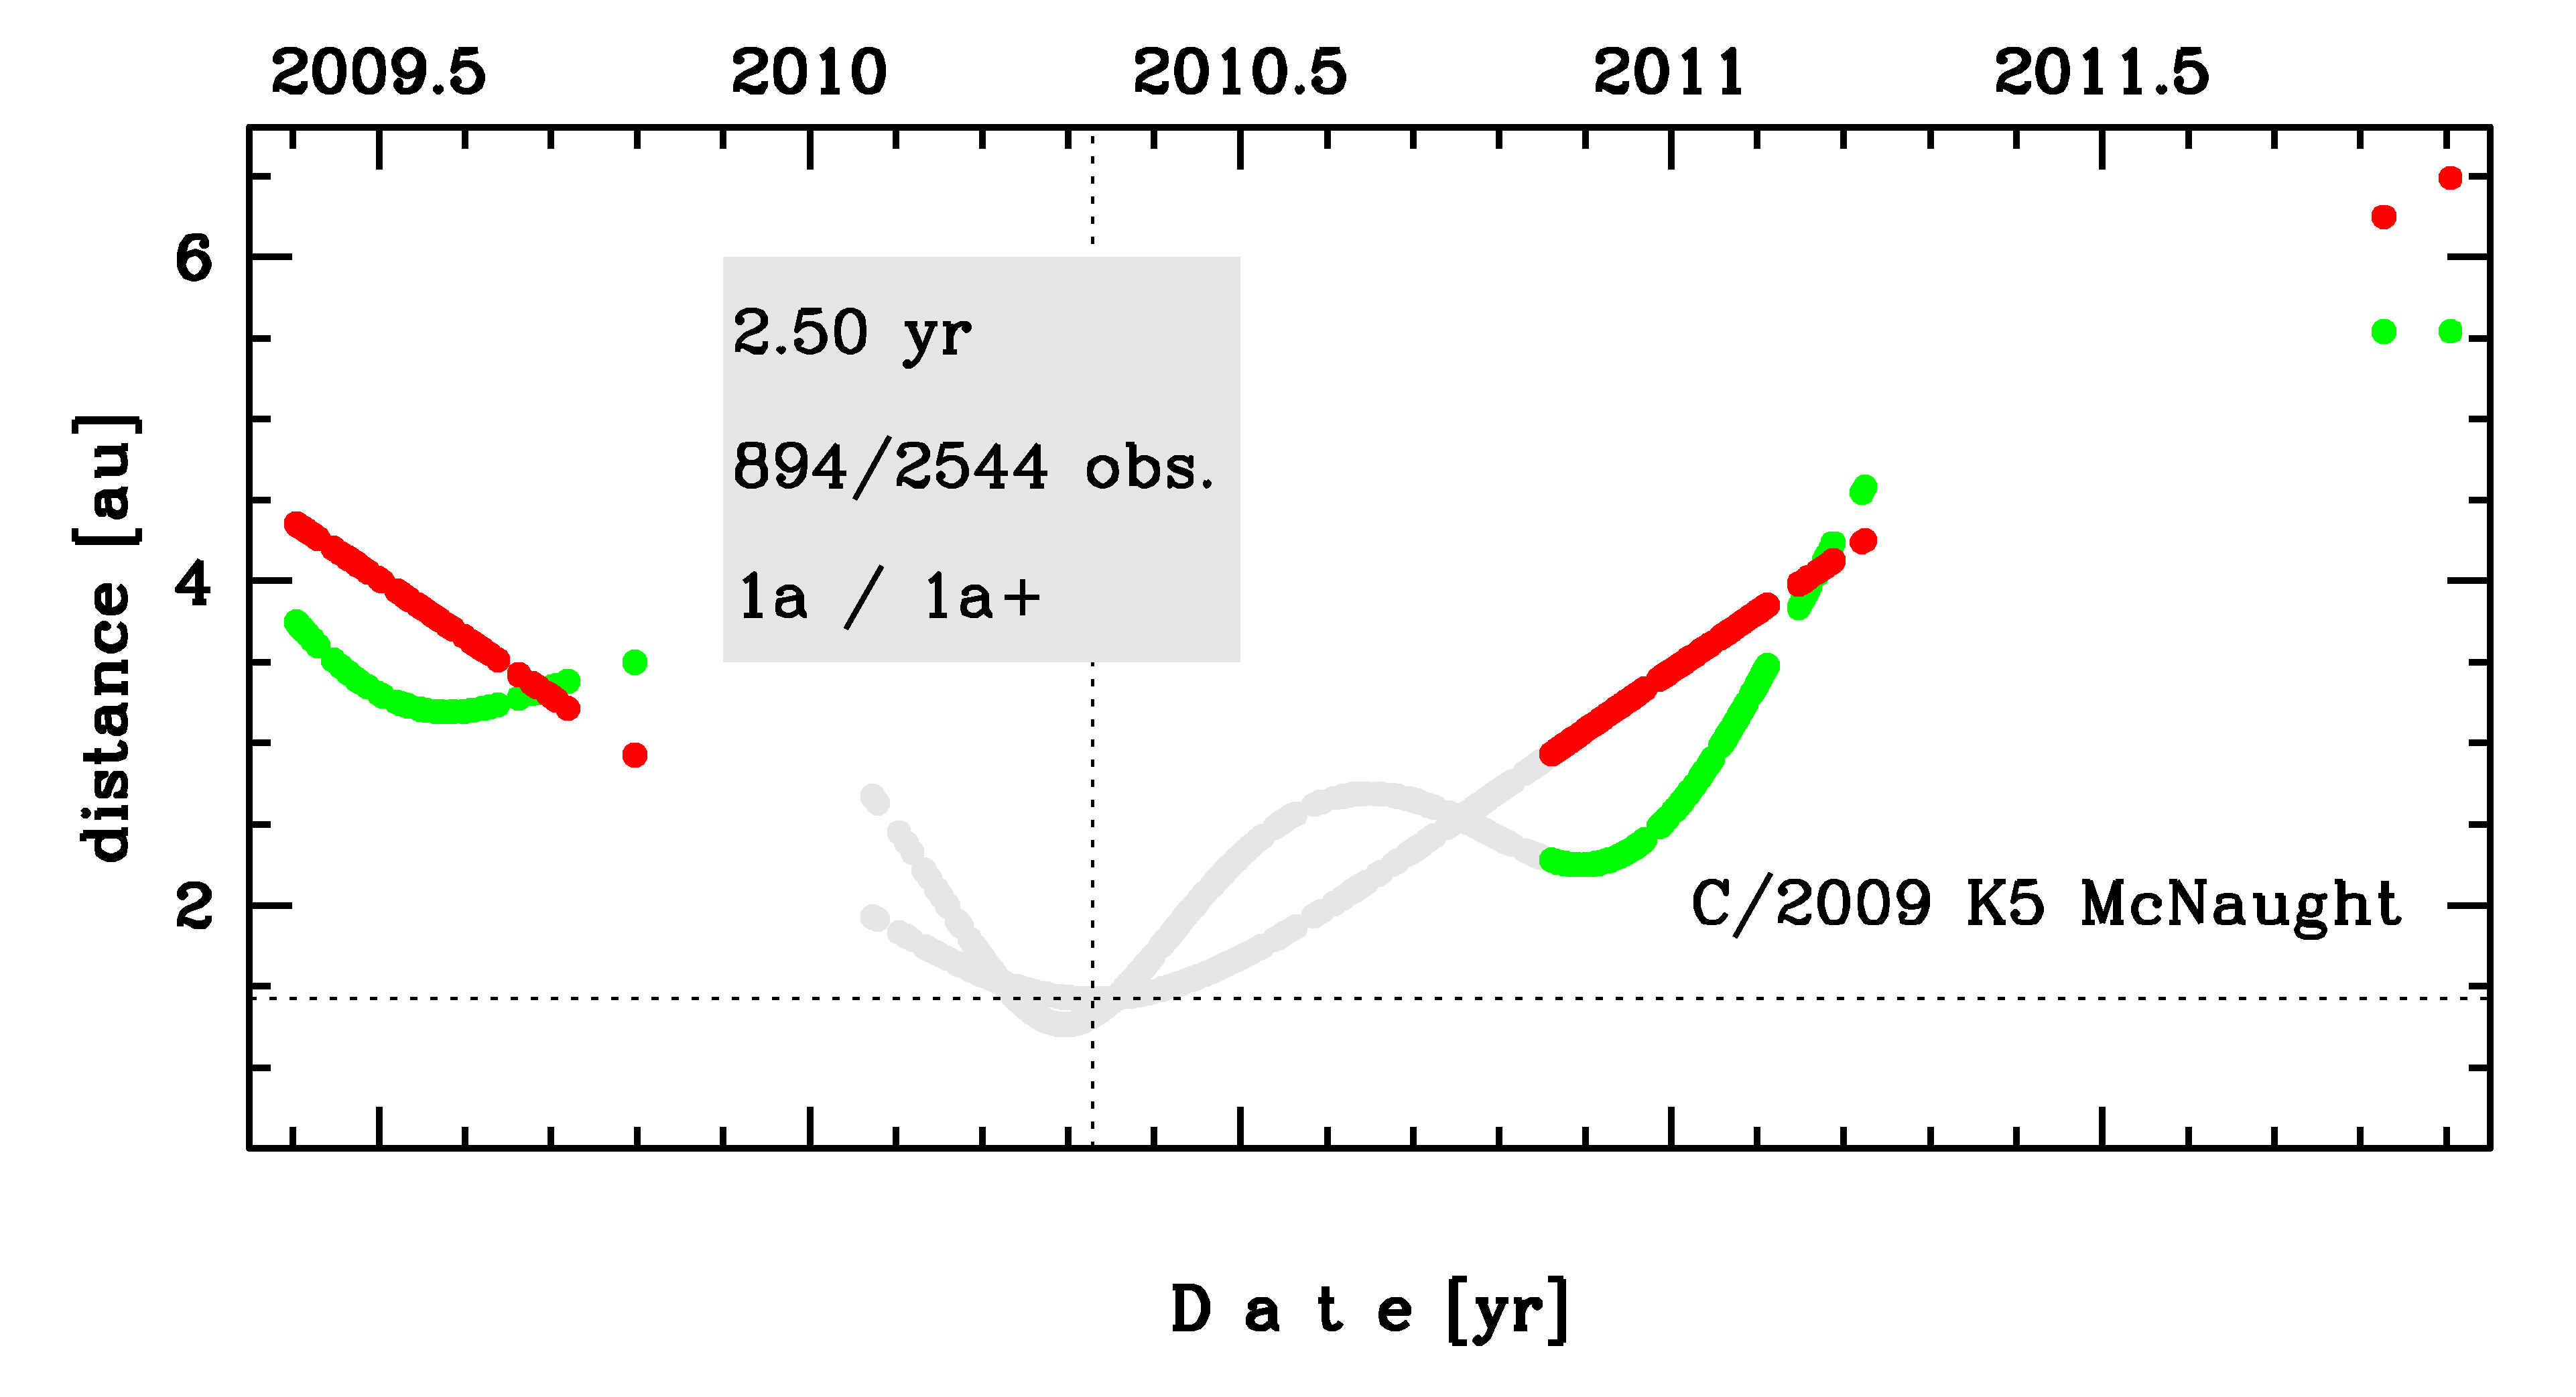
Time distribution of positional observations with corresponding heliocentric (red curve) and geocentric (green curve) distance at which they were taken. The horizontal dotted line shows the perihelion distance for a given comet whereas vertical dotted line — the moment of perihelion passage.
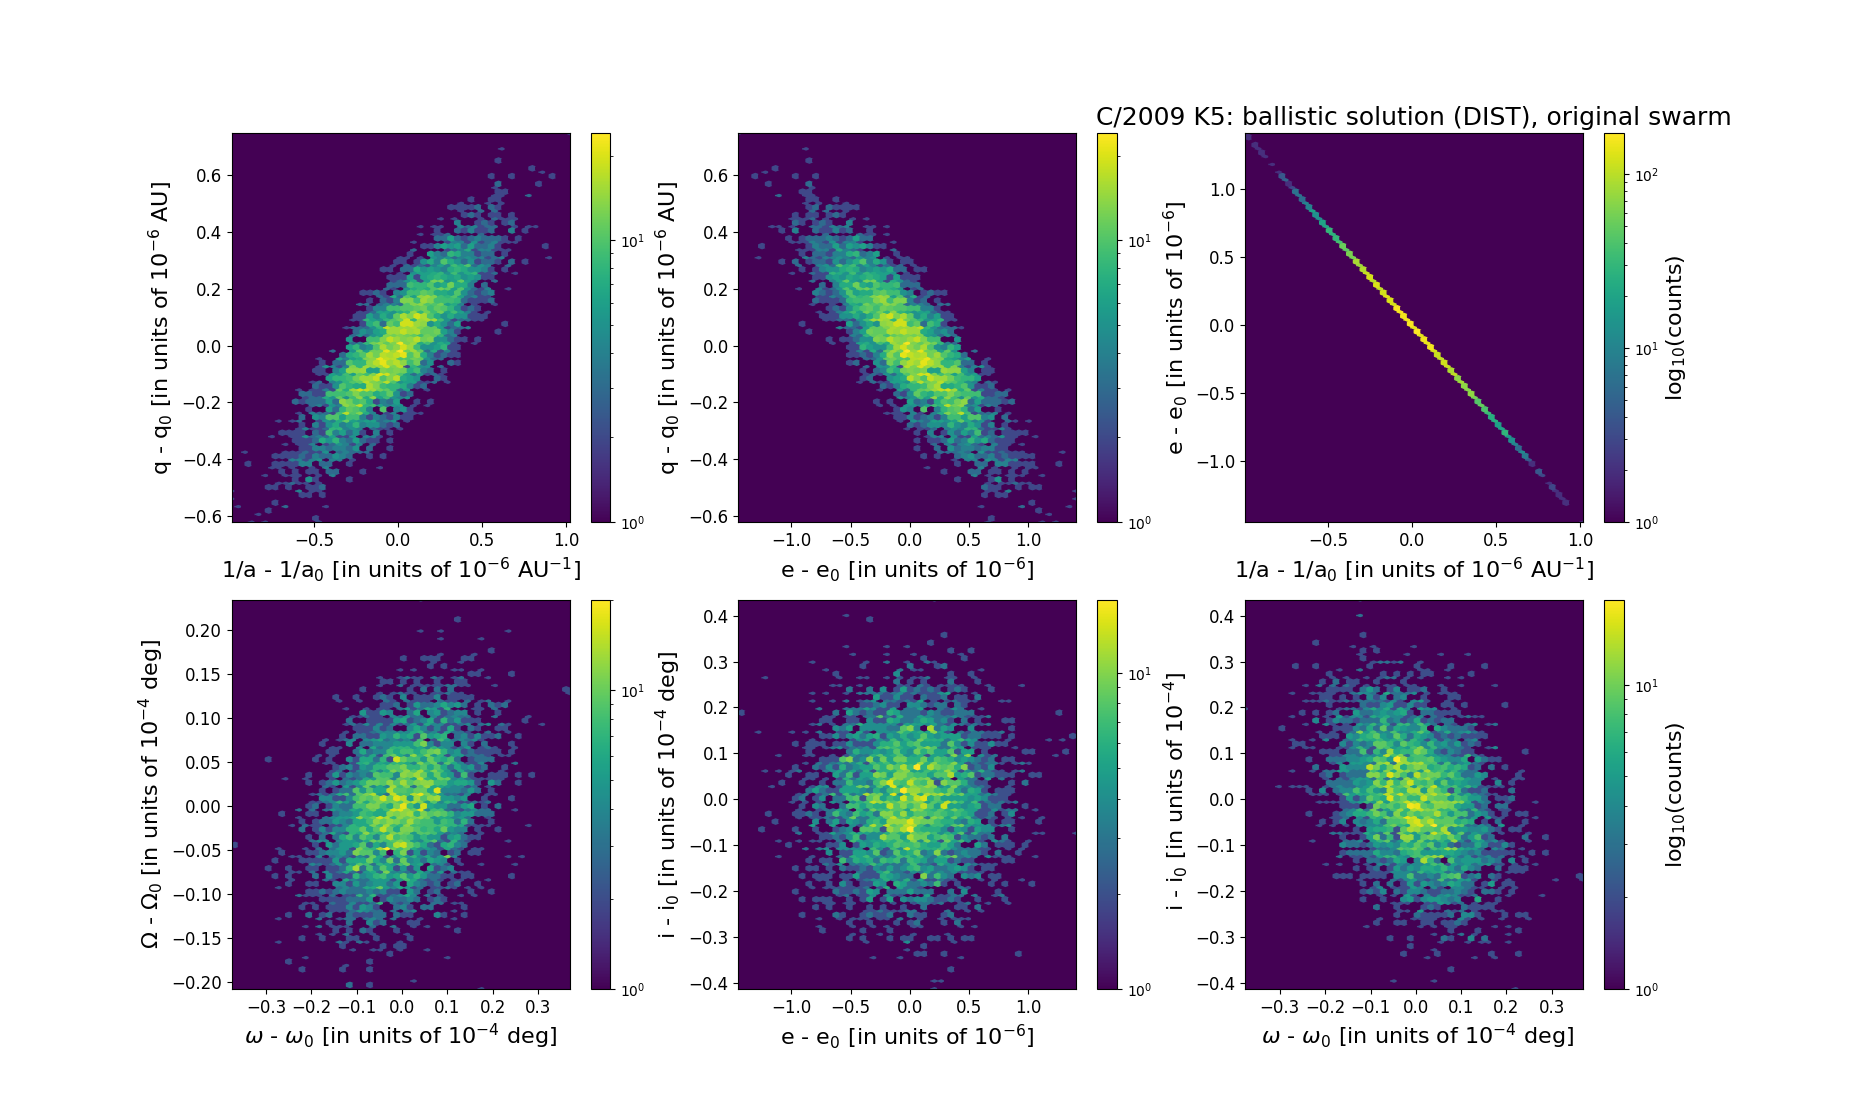
Six 2D-projections of the 6D space of original swarm including 5001 VCs. Each density map is given in logarithmic scale presented on the right in the individual panel.