C/2009 P2 Boattini
more info
C/2009 P2 was discovered by Andrea Boattini on 15 August 2009 during the Catalina Sky Survey with the 0.68 m Schmidt; its cometary apperance was next confirmed by several amateur observers. Later, positional observations of C/2009 P2 were linked with data of two asteroidal objects: 2008 TQ137 and 2008 VP28 taken between 1–9 October 2008 [MPEC 2009-R29, 2009 Sept. 9].
This comet made its closest approaches to the Earth on 21 September 2009 (5.649 au, 4.7 months before perihelion passage) and 17 August 2010 (5.704 au, 6.2 months after perihelion), see figure.
Solution given here is based on data spanning over 2.8 yr in a range of heliocentric distances: 7.33 au – 6.544 au (perihelion) – 7.53 au.
This Oort spike comet suffers tiny planetary perturbations during its passage through the planetary system.
See also Królikowska 2014 and Królikowska and Dybczyński 2017.
| solution description | ||
|---|---|---|
| number of observations | 503 | |
| data interval | 2008 10 01 – 2011 07 29 | |
| data type | perihelion within the observation arc (FULL) | |
| data arc selection | entire data set (STD) | |
| range of heliocentric distances | 7.33 au – 6.54 au (perihelion) – 7.53 au | |
| detectability of NG effects in the comet's motion | NG effects not determinable | |
| type of model of motion | GR - gravitational orbit | |
| data weighting | YES | |
| number of residuals | 982 | |
| RMS [arcseconds] | 0.51 | |
| orbit quality class | 1a | |
| previous orbit statistics, both Galactic and stellar perturbations were taken into account | ||
|---|---|---|
| no. of returning VCs in the swarm | 4940 | * |
| no. of escaping VCs in the swarm | 61 | |
| no. of hyperbolas among escaping VCs in the swarm | 0 | |
| previous reciprocal semi-major axis [10-6 au-1] | 16.97 – 18.83 – 20.75 | R |
| previous perihelion distance [au] | 120 – 300 – 480 | R |
| previous aphelion distance [103 au] | 95.9 – 106 – 118 | R |
| time interval to previous perihelion [Myr] | 9.9 – 11 – 13 | R |
| percentage of VCs with qprev > 20 | 100 | |
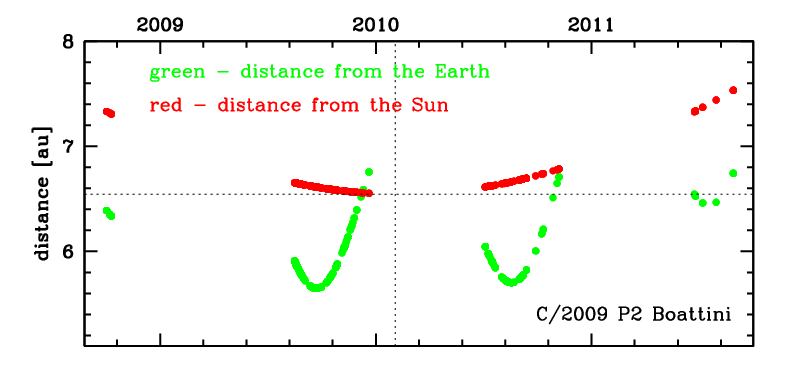
Time distribution of positional observations with corresponding heliocentric (red curve) and geocentric (green curve) distance at which they were taken. The horizontal dotted line shows the perihelion distance for a given comet whereas vertical dotted line — the moment of perihelion passage.
| previous_g orbit statistics, here only the Galactic tide has been included | ||
|---|---|---|
| no. of returning VCs in the swarm | 5001 | * |
| no. of escaping VCs in the swarm | 0 | |
| no. of hyperbolas among escaping VCs in the swarm | 0 | |
| previous reciprocal semi-major axis [10-6 au-1] | 19.26 – 21.00 – 22.77 | |
| previous perihelion distance [au] | 110 – 190 – 340 | |
| previous aphelion distance [103 au] | 87.7 – 95 – 104 | |
| time interval to previous perihelion [Myr] | 8.8 – 9.8 – 11 | |
| percentage of VCs with qprev > 20 | 100 | |