C/2011 J2 LINEAR
more info
Comet C/2011 J2 was discovered on 4 May 2011 by LINEAR, that is about 2.6 yr before its perihelion passage. Next, it was found on earlier images taken on 10 and 25 March 2011 with the Catalina Sky Survey. More than seven months after perihelion passage (in August 2014), splitting event was observed. In 2016, Manzini et al., investigated the motion of fragment B over the observation period and they showed that the first breakout event likely occurred between 12 July and 30 July 2014. Therefore, solutions given here are based on data-arc including measurements taken well before this fragmentation event. The comet was observed until 15 September 2017.
Comet had its closest approach to the Earth (3.02 au) a few days before perihelion passage.
Solutions given here was based on data spanning over 3.3 yr in a range of heliocentric distances: 8.97 au – 3.44 au (perihelion) – 3.84 au.
This Oort spike comet suffers tiny planetary perturbations during its passage through the planetary system. The future orbit is uncertain due to splitting event.
| solution description | ||
|---|---|---|
| number of observations | 3369 | |
| data interval | 2011 03 10 – 2014 06 28 | |
| data arc selection | data generally limited to pre-perihelion (PRE) | |
| range of heliocentric distances | 8.97 au – 3.44 au (perihelion) – 3.84 au | |
| type of model of motion | NC - non-gravitational orbits for symmetric CO-g(r)-like function | |
| data weighting | YES | |
| number of residuals | 6687 | |
| RMS [arcseconds] | 0.35 | |
| orbit quality class | 1a+ | |
| previous orbit statistics, both Galactic and stellar perturbations were taken into account | ||
|---|---|---|
| no. of returning VCs in the swarm | 5001 | * |
| no. of escaping VCs in the swarm | 0 | |
| no. of hyperbolas among escaping VCs in the swarm | 0 | |
| previous reciprocal semi-major axis [10-6 au-1] | 43.86 – 44.23 – 44.47 | |
| previous perihelion distance [au] | 300 – 350 – 410 | |
| previous aphelion distance [103 au] | 44.67 – 44.87 – 45.19 | |
| time interval to previous perihelion [Myr] | 2.85 – 2.93 – 3 | |
| percentage of VCs with qprev > 20 | 100 | |
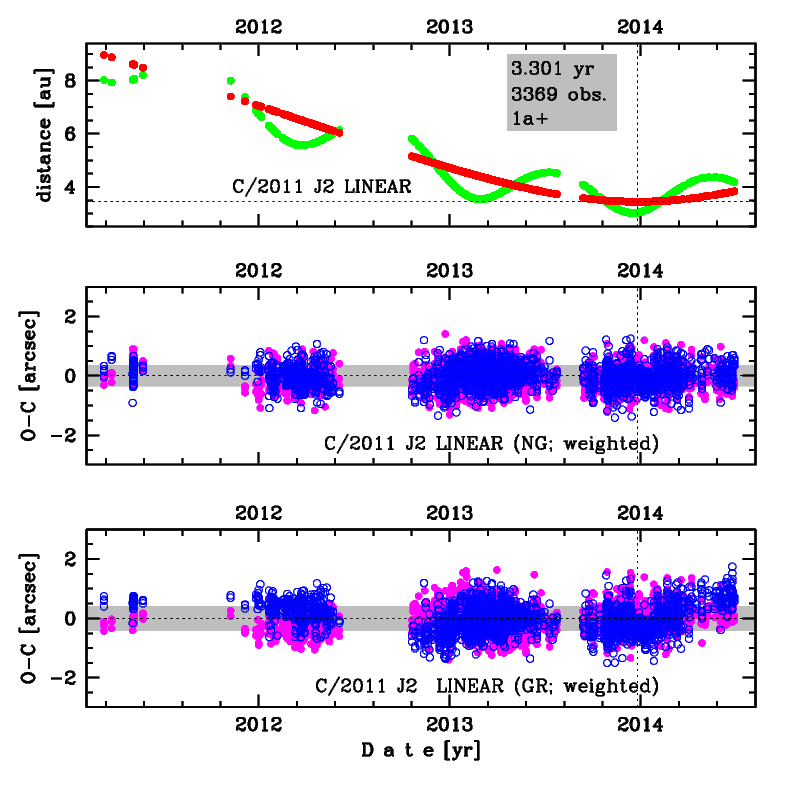
Upper panel: Time distribution of positional observations with corresponding heliocentric (red curve) and geocentric (green curve) distance at which they were taken. The horizontal dotted line shows the perihelion distance for a given comet whereas vertical dotted line — the moment of perihelion passage.
Lower panel (panels): O-C diagram for this(two) solution (solutions) given in this database, where residuals in right ascension are shown using magenta dots and in declination by blue open circles.
Lower panel (panels): O-C diagram for this(two) solution (solutions) given in this database, where residuals in right ascension are shown using magenta dots and in declination by blue open circles.
| previous_g orbit statistics, here only the Galactic tide has been included | ||
|---|---|---|
| no. of returning VCs in the swarm | 5001 | * |
| no. of escaping VCs in the swarm | 0 | |
| no. of hyperbolas among escaping VCs in the swarm | 0 | |
| previous reciprocal semi-major axis [10-6 au-1] | 48.10 – 48.93 – 49.74 | |
| previous perihelion distance [au] | 2.38 – 2.41 – 2.44 | |
| previous aphelion distance [103 au] | 40.2 – 40.9 – 41.6 | |
| time interval to previous perihelion [Myr] | 2.84 – 2.91 – 2.99 | |
| percentage of VCs with qprev < 10 | 100 | |