C/2011 M1 LINEAR
more info
Comet C/2011 M1 was discovered on 22 June 2011 during Lincoln Laboratory Near-Earth Asteroid Research project, that is 2.5 months before its perihelion passage. It was observed until 2 August 2011.
Comet had its closest approach to the Earth on 27 July 2011 (1.267 au), a bit more than a month after its discovery.
Solution given here is based on pre-perihelion data spanning over 0.112 yr in a range of heliocentric distances from 1.59 au to 1.10 au.
Original value of 1/a is negative; however within its uncertainty of about 3 sigma this comet can came from the Oort Cloud.
C/2011 M1 was observed only before peryhelion; future orbit is given here though it is not certin that this comet survived perihelion passage. See also Table 2 in Sekanina 2019.
See also Królikowska 2020.
| solution description | ||
|---|---|---|
| number of observations | 122 | |
| data interval | 2011 06 22 – 2011 08 02 | |
| data type | observed only before perihelion (PRE) | |
| data arc selection | entire data set (STD) | |
| range of heliocentric distances | 1.59 au – 1.1au | |
| detectability of NG effects in the comet's motion | NG effects not determinable | |
| type of model of motion | GR - gravitational orbit | |
| data weighting | YES | |
| number of residuals | 236 | |
| RMS [arcseconds] | 0.72 | |
| orbit quality class | 3a | |
| orbital elements (barycentric ecliptic J2000) | ||
|---|---|---|
| Epoch | 1729 06 06 | |
| perihelion date | 2011 09 06.54978790 | ± 0.00574692 |
| perihelion distance [au] | 0.88775160 | ± 0.00019513 |
| eccentricity | 1.00137296 | ± 0.00044964 |
| argument of perihelion [°] | 119.833839 | ± 0.019093 |
| ascending node [°] | 324.765870 | ± 0.003750 |
| inclination [°] | 70.343692 | ± 0.000332 |
| reciprocal semi-major axis [10-6 au-1] | -1,546.55 | ± 506.15 |
| file containing 5001 VCs swarm |
|---|
| 2011m1a5.bmi |
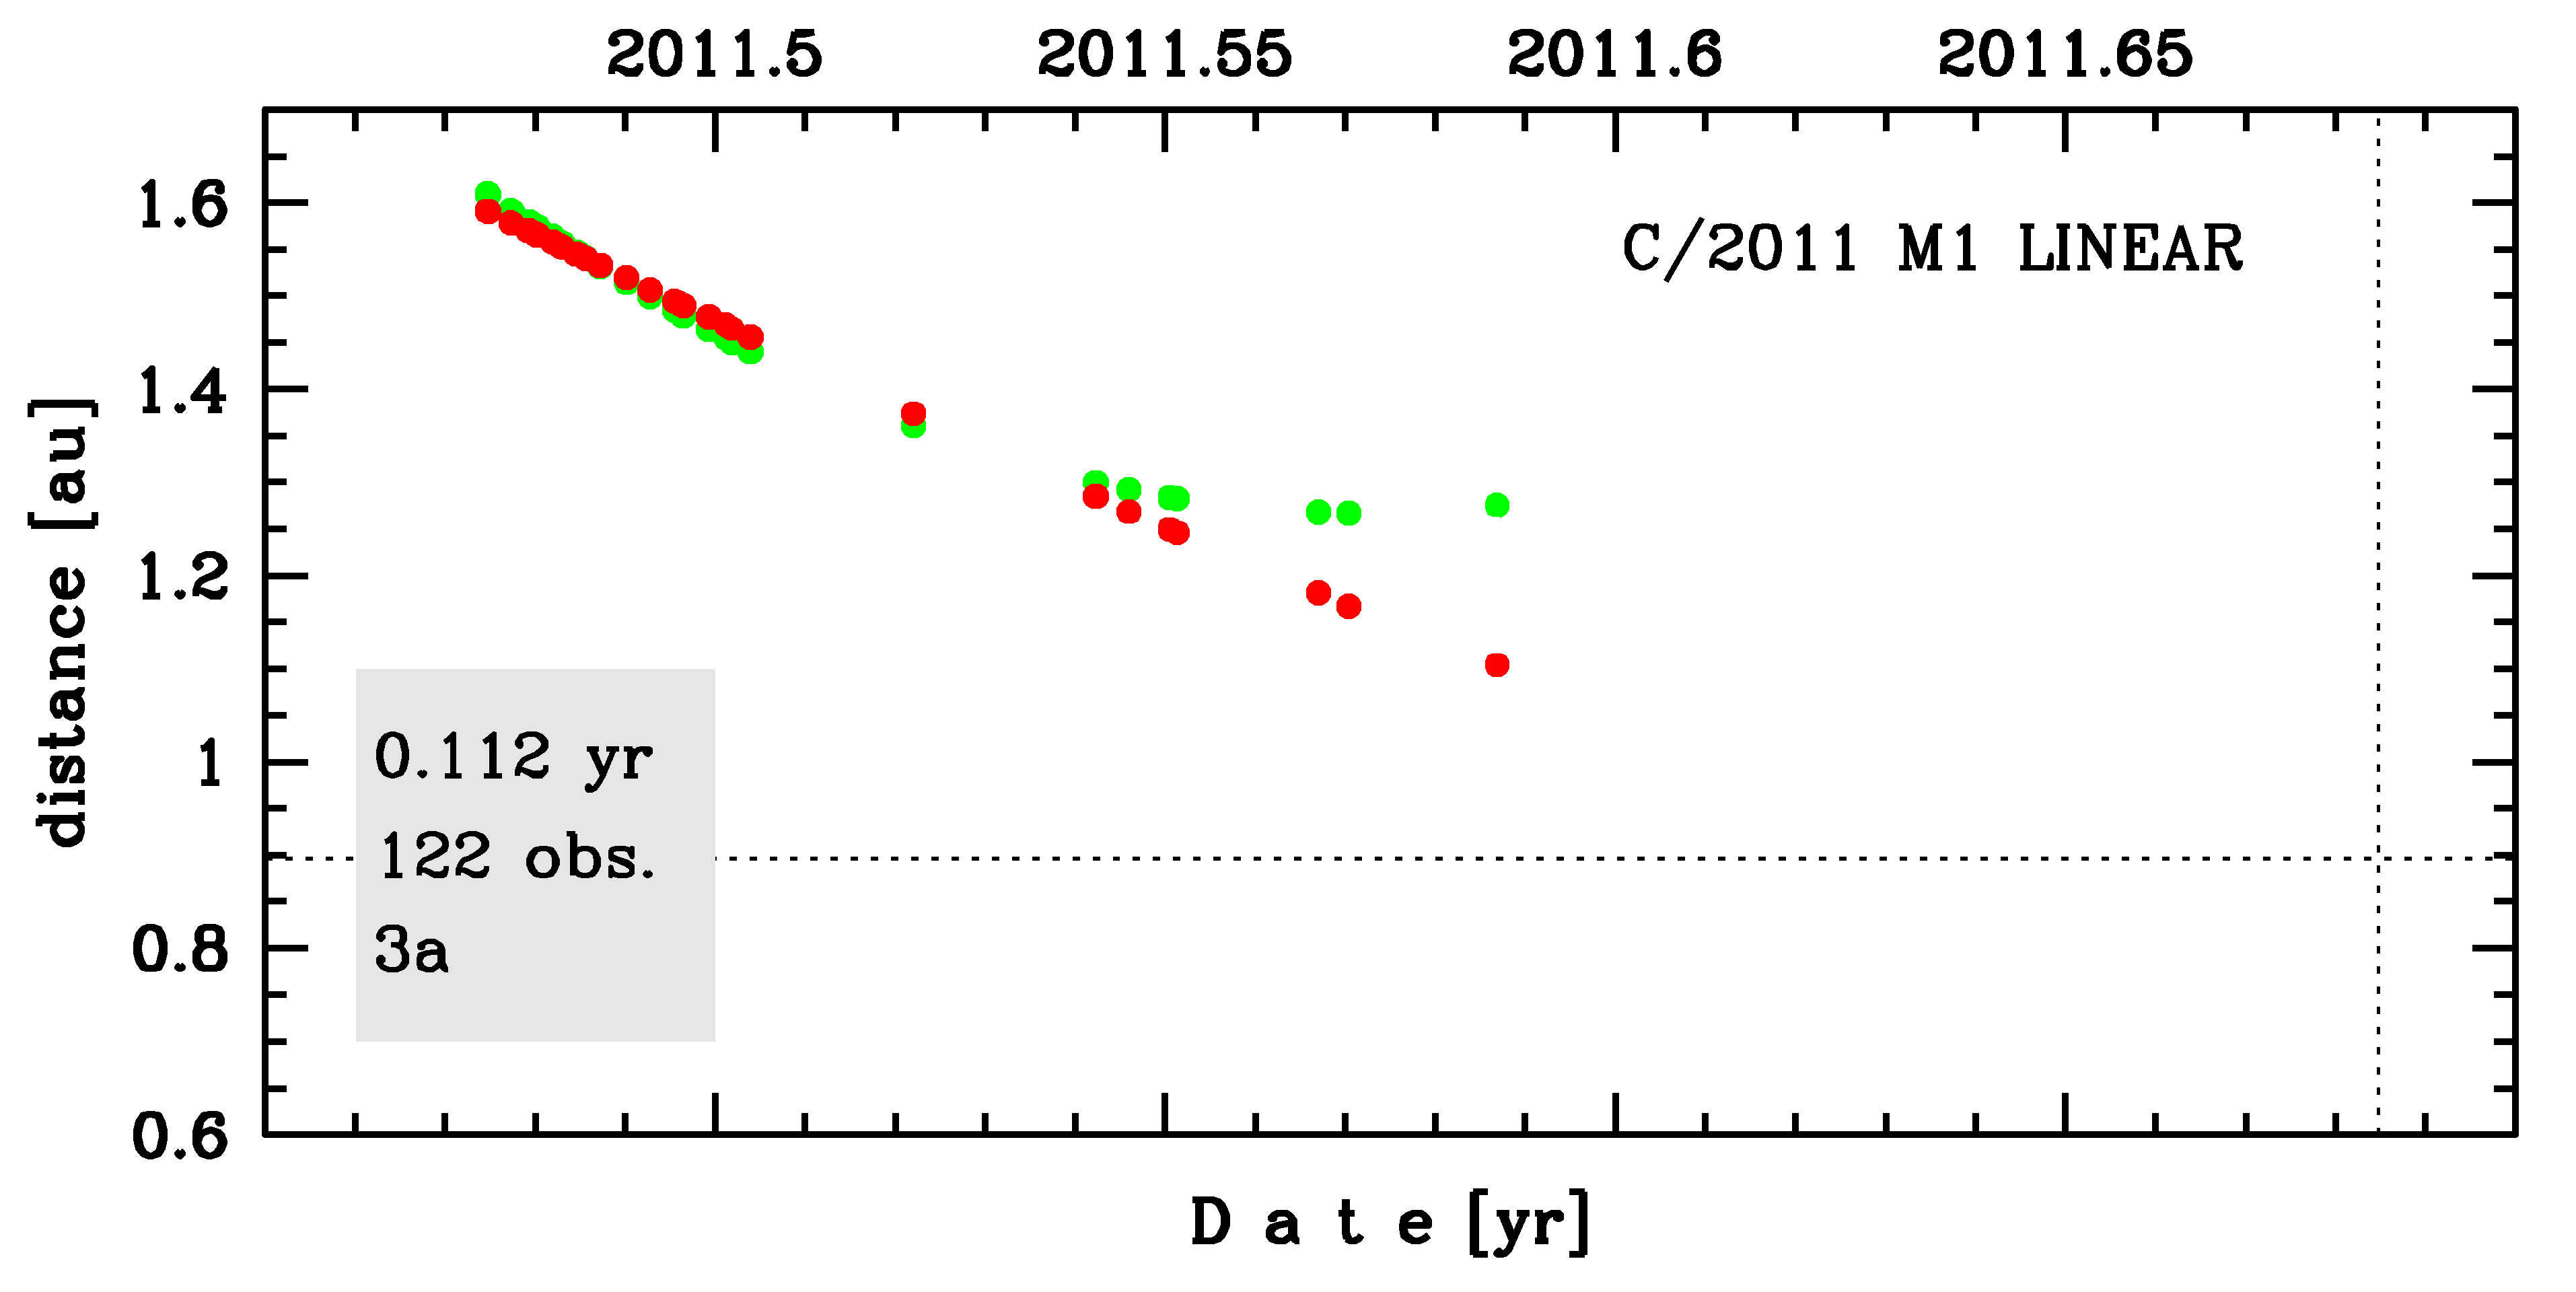
Time distribution of positional observations with corresponding heliocentric (red curve) and geocentric (green curve) distance at which they were taken. The horizontal dotted line shows the perihelion distance for a given comet whereas vertical dotted line — the moment of perihelion passage.
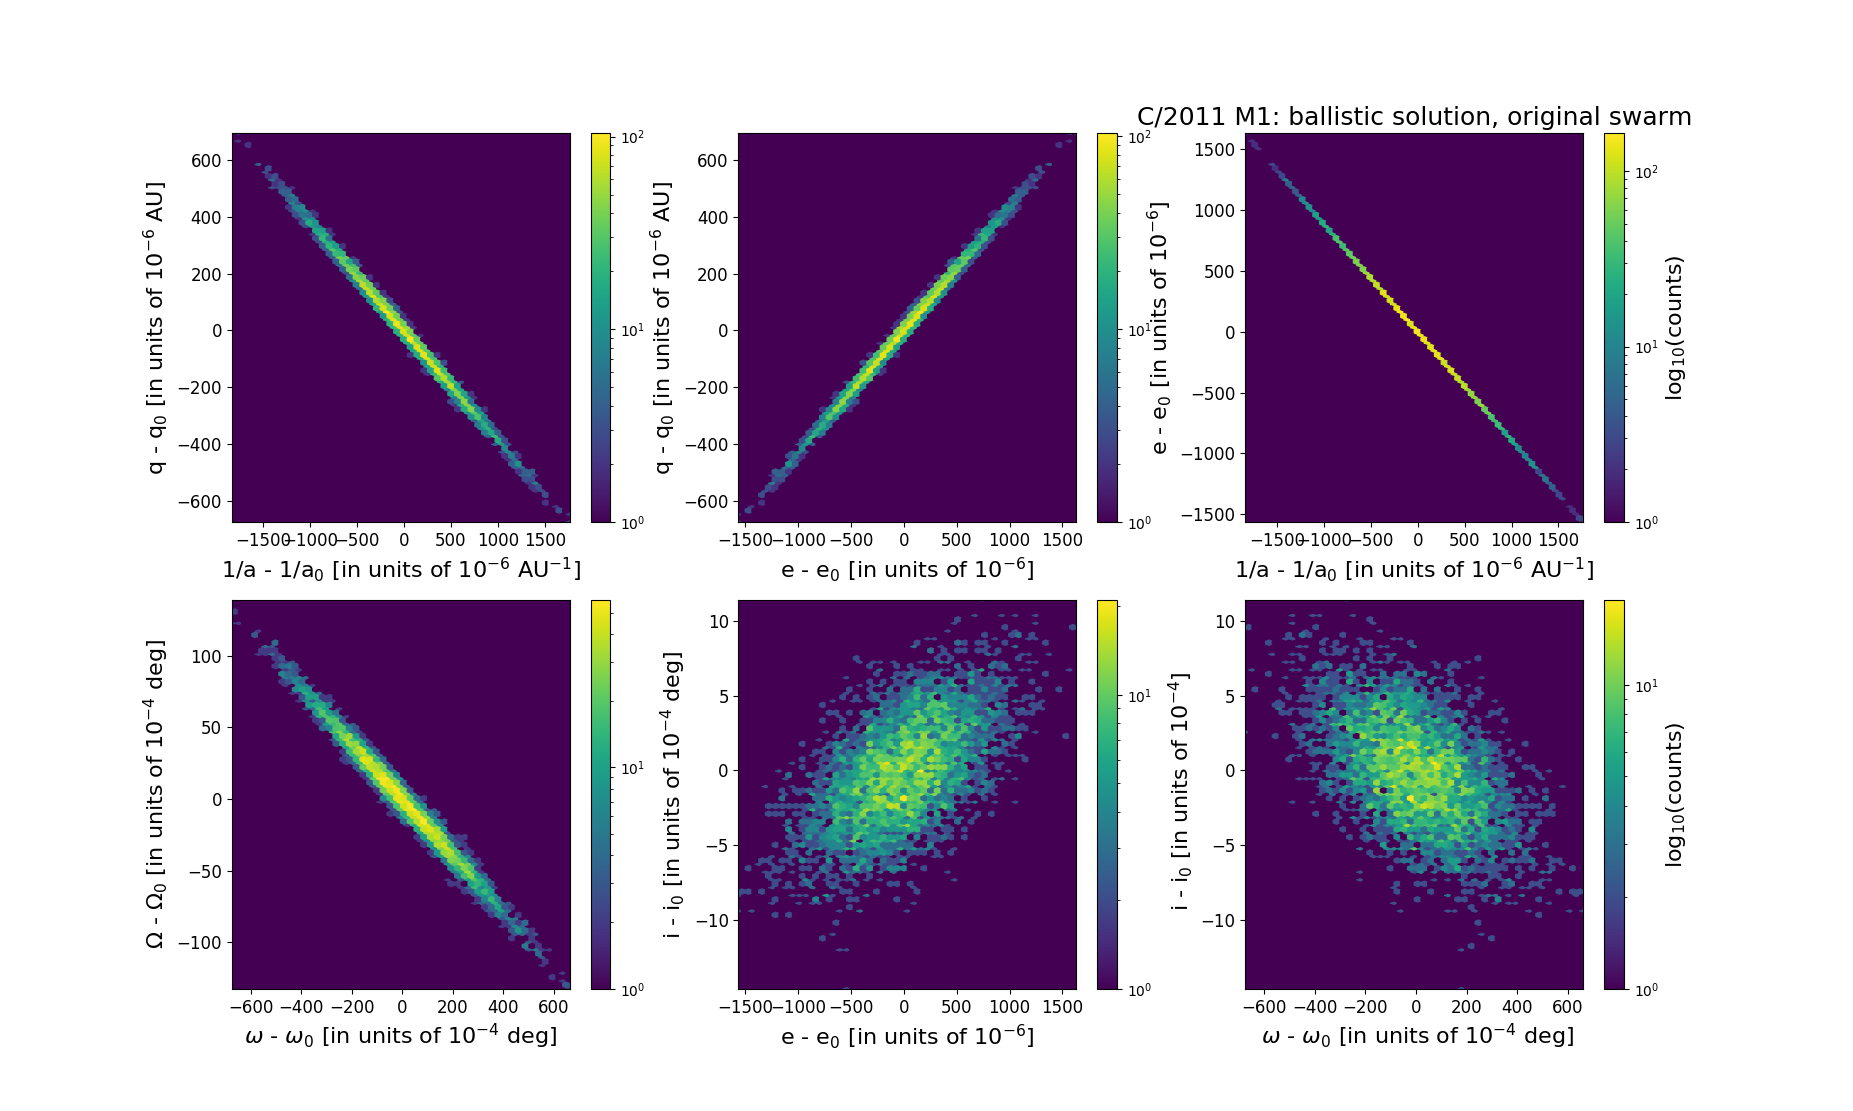
Six 2D-projections of the 6D space of original swarm including 5001 VCs. Each density map is given in logarithmic scale presented on the right in the individual panel.