C/2011 R1 McNaught
more info
Comet C/2011 R1 was discovered on 3 September 2011 by Robert H. McNaught (Siding Spring), that is more than a year before its perihelion passage. It was observed until 11 April 2014.
Comet had its closest approach to the Earth on 8 April 2013 (1.960 au), 5.5 months after its perihelion passage; however on 8 August 2012 (2.5 months before perihelion) the comet approached the Earth only a little further (2.035 au, see picture).
Solution given here is based on data spanning over 3.5 yr in a range of heliocentric distances: 7.47 au – 2.08 au (perihelion) – 5.91 au.
This Oort spike comet suffers tiny planetary perturbations during its passage through the planetary system that cause a bit tighter future orbit with original semimajor axis of about 10,000 au (see future barycentric orbits).
See also Królikowska 2020.
| solution description | ||
|---|---|---|
| number of observations | 1504 | |
| data interval | 2010 10 11 – 2014 04 11 | |
| data type | perihelion within the observation arc (FULL) | |
| data arc selection | entire data set (STD) | |
| range of heliocentric distances | 7.47 au – 2.08 au (perihelion) – 5.91 au | |
| detectability of NG effects in the comet's motion | comet with determinable NG~orbit | |
| type of model of motion | GR - gravitational orbit | |
| data weighting | YES | |
| number of residuals | 2989 | |
| RMS [arcseconds] | 0.44 | |
| orbit quality class | 1a+ | |
| next orbit statistics, both Galactic and stellar perturbations were taken into account | ||
|---|---|---|
| no. of returning VCs in the swarm | 5001 | * |
| no. of escaping VCs in the swarm | 0 | |
| no. of hyperbolas among escaping VCs in the swarm | 0 | |
| next reciprocal semi-major axis [10-6 au-1] | 133.37 – 133.69 – 133.99 | |
| next perihelion distance [au] | 2.1069 – 2.1071 – 2.1074 | |
| next aphelion distance [103 au] | 14.92 – 14.96 – 14.99 | |
| time interval to next perihelion [Myr] | 0.644 – 0.6463 – 0.6486 | |
| percentage of VCs with qnext < 10 | 100 | |
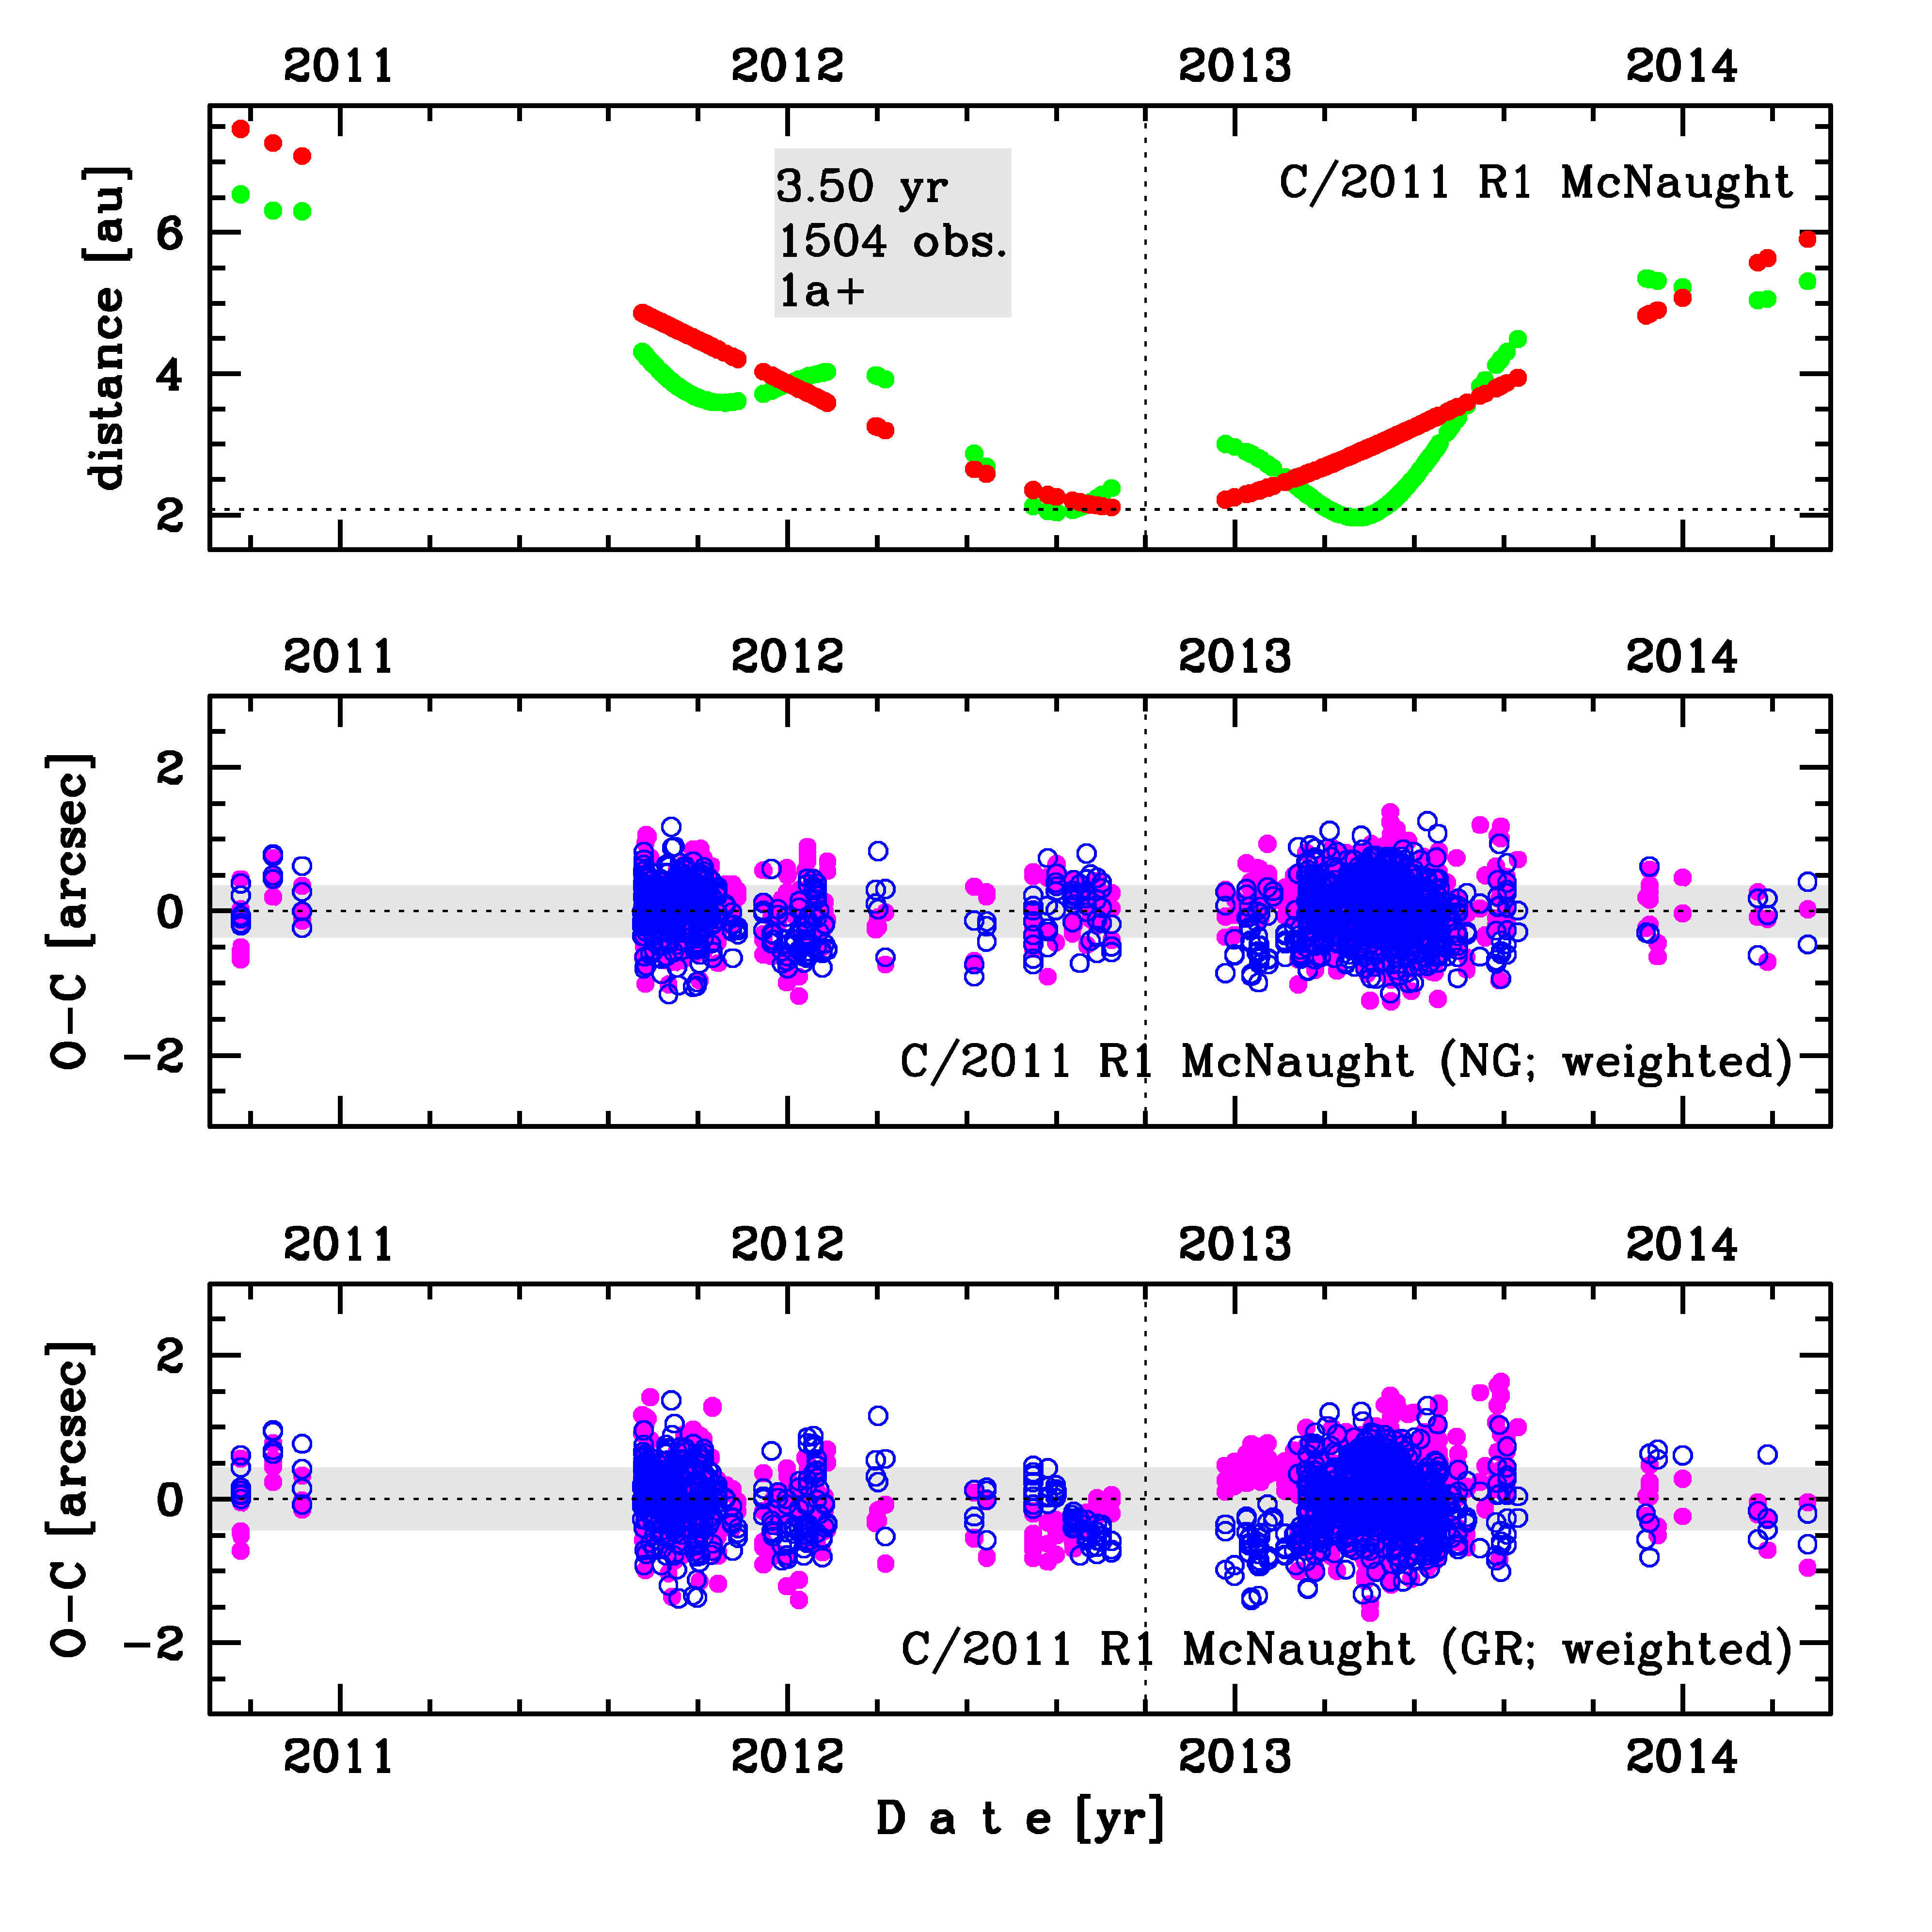
Upper panel: Time distribution of positional observations with corresponding heliocentric (red curve) and geocentric (green curve) distance at which they were taken. The horizontal dotted line shows the perihelion distance for a given comet whereas vertical dotted line — the moment of perihelion passage.
Lower panel (panels): O-C diagram for this(two) solution (solutions) given in this database, where residuals in right ascension are shown using magenta dots and in declination by blue open circles.
Lower panel (panels): O-C diagram for this(two) solution (solutions) given in this database, where residuals in right ascension are shown using magenta dots and in declination by blue open circles.
| next_g orbit statistics, here only the Galactic tide has been included | ||
|---|---|---|
| no. of returning VCs in the swarm | 5001 | * |
| no. of escaping VCs in the swarm | 0 | |
| no. of hyperbolas among escaping VCs in the swarm | 0 | |
| next reciprocal semi-major axis [10-6 au-1] | 133.35 – 133.66 – 133.97 | |
| next perihelion distance [au] | 2.1101 – 2.1103 – 2.1106 | |
| next aphelion distance [103 au] | 14.93 – 14.96 – 15 | |
| time interval to next perihelion [Myr] | 0.6442 – 0.6464 – 0.6487 | |
| percentage of VCs with qnext < 10 | 100 | |