C/2012 K1 PANSTARRS
more info
Comet C/2012 K1 was discovered on 19 May 2012 with Pan-STARRS 1 telescope (Haleakala), that is more than 2 years before its perihelion passage. Later a few pre-discovery images were found taken on 14 May ( MASTER-II Observatory, Tunka) and 17 May (Pan-STARRS 1). It was almost systematically observed until 7 August 2016 (see picture).
C/2012 K1 had its closest approach to the Earth on 31 October 2014 (0.953 au), about 2 months after its perihelion passage.
Preferred solution given here is based on data spanning over 4.23 yr in a range of heliocentric distances: 8.83 au – 1.055 au (perihelion) – 7.85 au.
This Oort spike comet suffers small planetary perturbations during its passage through the planetary system that cause a bit tighter future orbit (see future barycentric orbits).
See also Królikowska 2020.
| solution description | ||
|---|---|---|
| number of observations | 7871 | |
| data interval | 2012 05 14 – 2016 08 07 | |
| data type | perihelion within the observation arc (FULL) | |
| data arc selection | entire data set (STD) | |
| range of heliocentric distances | 8.83 au – 1.05 au (perihelion) – 7.85 au | |
| type of model of motion | NS - non-gravitational orbits for standard g(r) | |
| data weighting | YES | |
| number of residuals | 15569 | |
| RMS [arcseconds] | 0.34 | |
| orbit quality class | 1a+ | |
| previous orbit statistics, both Galactic and stellar perturbations were taken into account | ||
|---|---|---|
| no. of returning VCs in the swarm | 5001 | * |
| no. of escaping VCs in the swarm | 0 | |
| no. of hyperbolas among escaping VCs in the swarm | 0 | |
| previous reciprocal semi-major axis [10-6 au-1] | 40.58 – 40.86 – 41.15 | |
| previous perihelion distance [au] | 723 – 745 – 767 | |
| previous aphelion distance [103 au] | 47.88 – 48.2 – 48.52 | |
| time interval to previous perihelion [Myr] | 3.66 – 3.7 – 3.74 | |
| percentage of VCs with qprev > 20 | 100 | |
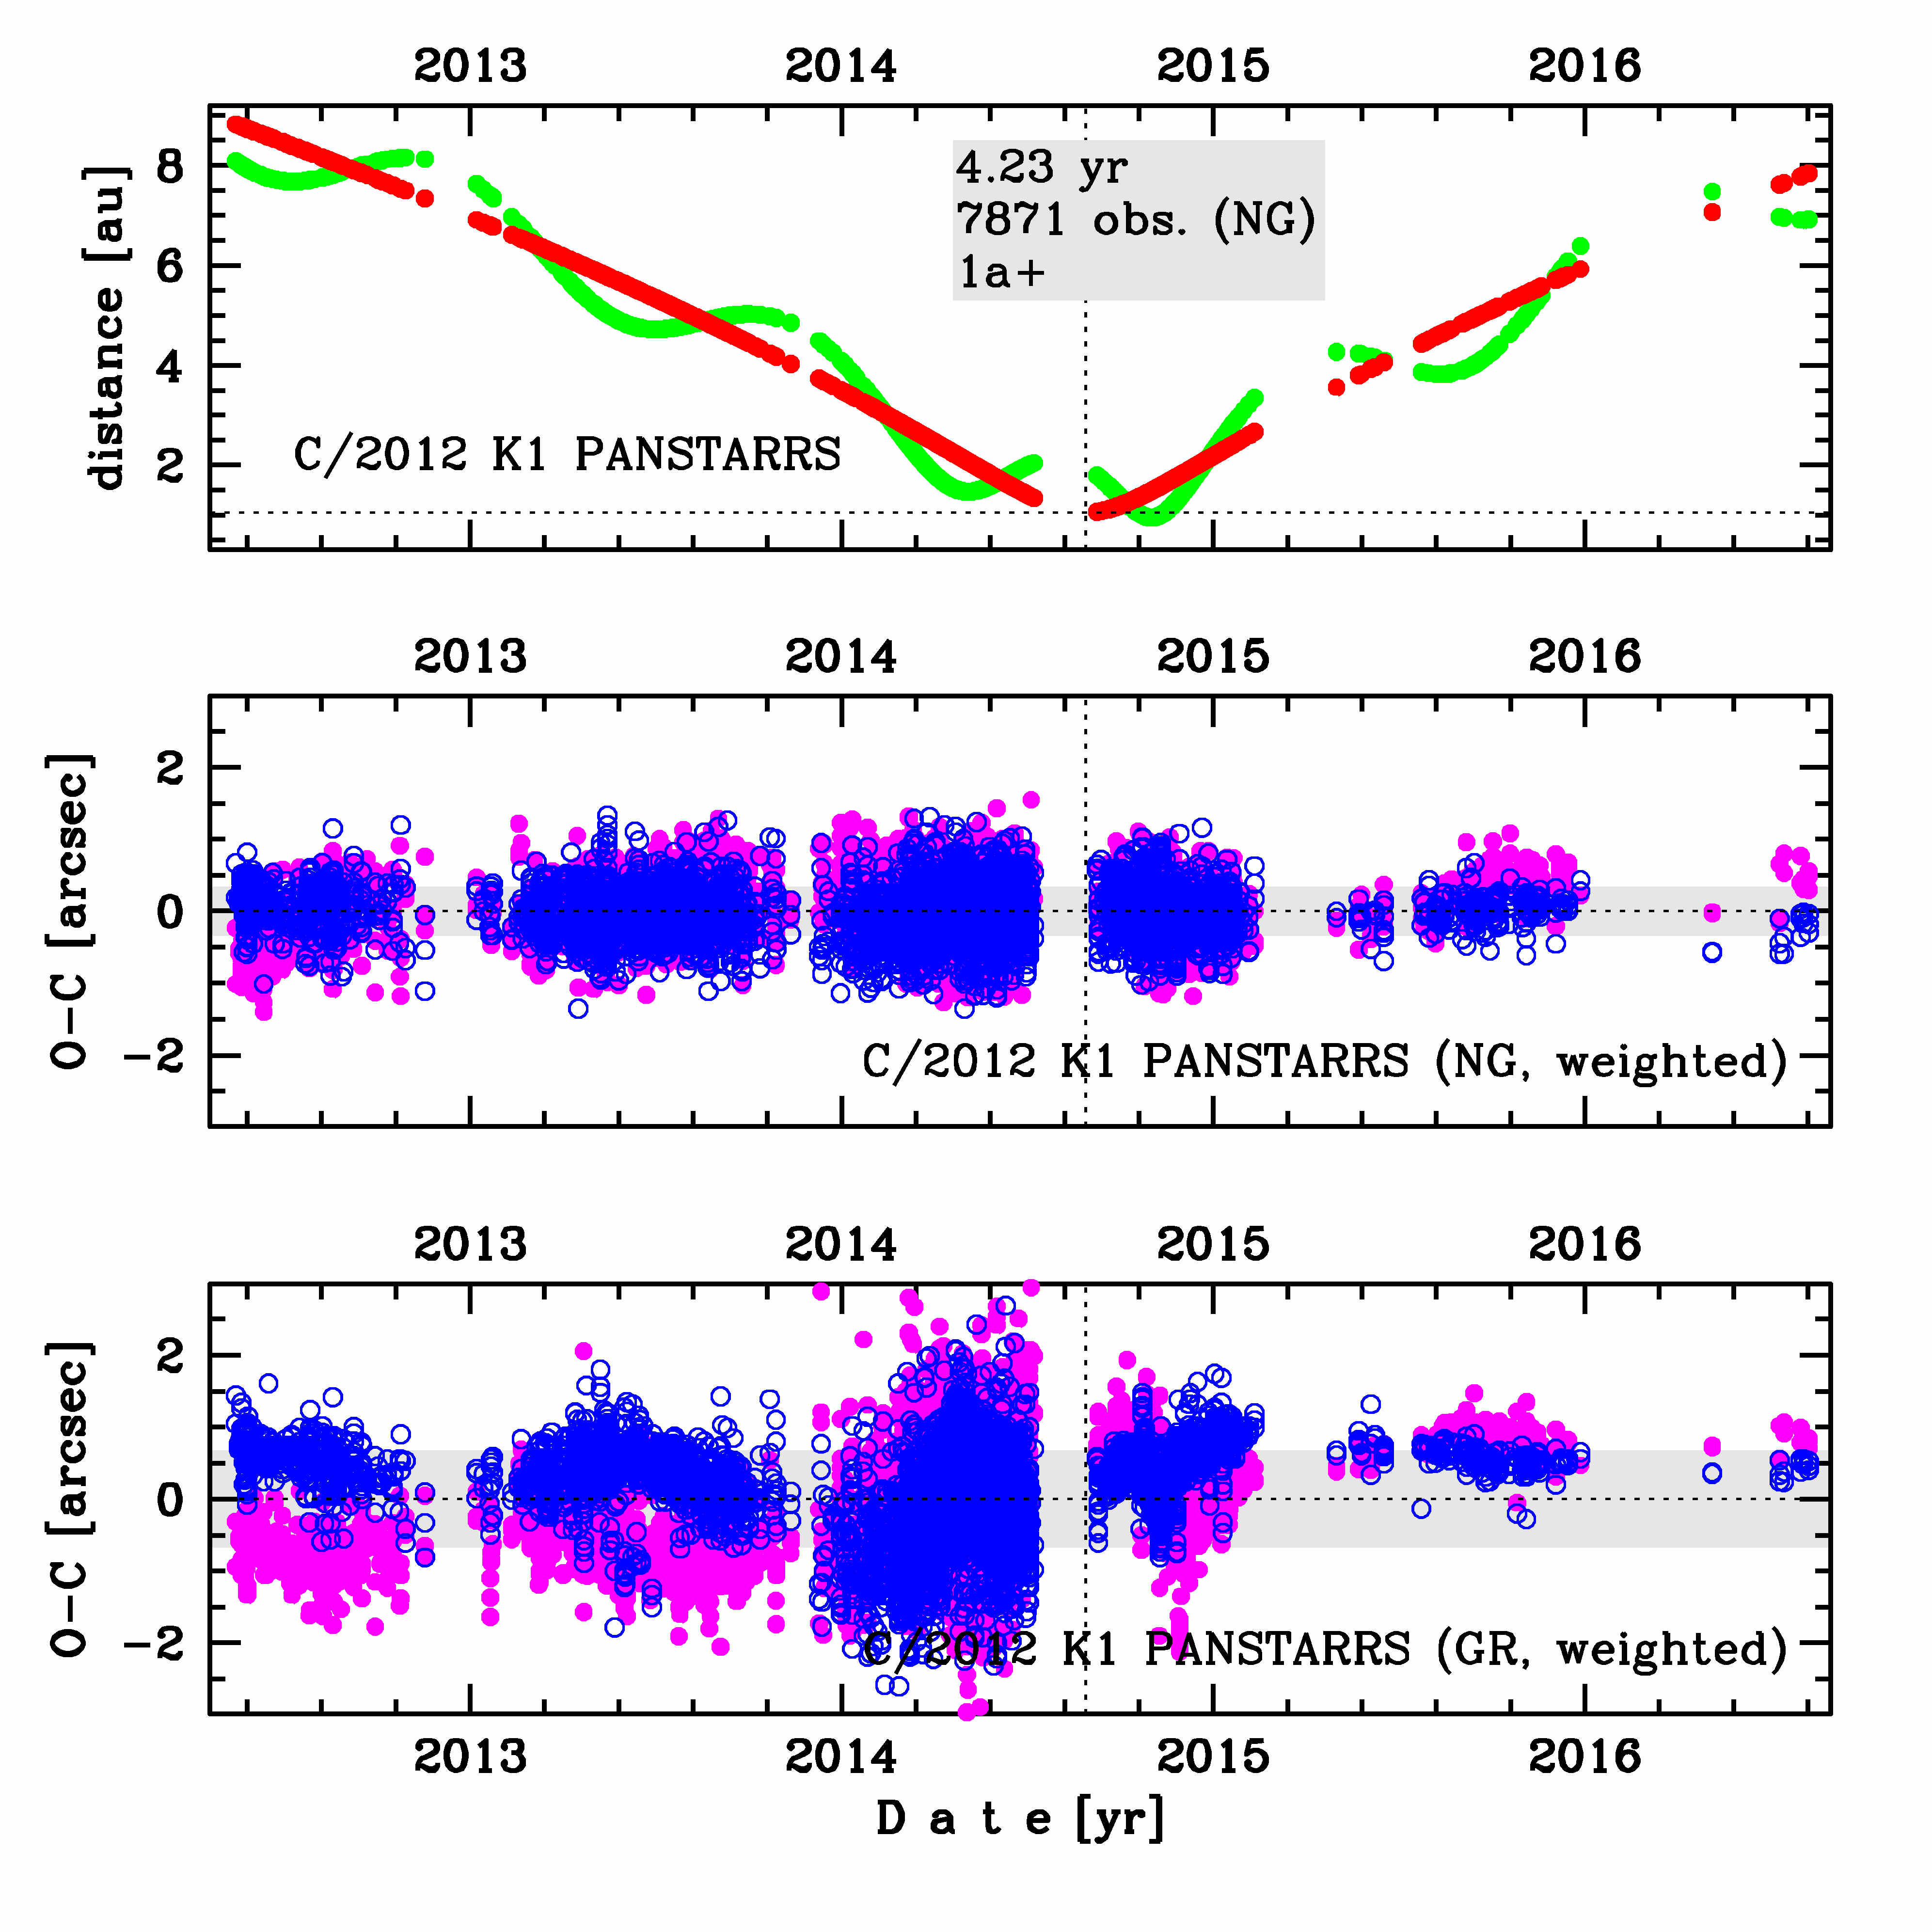
Upper panel: Time distribution of positional observations with corresponding heliocentric (red curve) and geocentric (green curve) distance at which they were taken. The horizontal dotted line shows the perihelion distance for a given comet whereas vertical dotted line — the moment of perihelion passage.
Lower panel (panels): O-C diagram for this(two) solution (solutions) given in this database, where residuals in right ascension are shown using magenta dots and in declination by blue open circles.
Lower panel (panels): O-C diagram for this(two) solution (solutions) given in this database, where residuals in right ascension are shown using magenta dots and in declination by blue open circles.
| previous_g orbit statistics, here only the Galactic tide has been included | ||
|---|---|---|
| no. of returning VCs in the swarm | 5001 | * |
| no. of escaping VCs in the swarm | 0 | |
| no. of hyperbolas among escaping VCs in the swarm | 0 | |
| previous reciprocal semi-major axis [10-6 au-1] | 41.52 – 41.81 – 42.11 | |
| previous perihelion distance [au] | 0.16 – 0.168 – 0.178 | |
| previous aphelion distance [103 au] | 47.49 – 47.83 – 48.17 | |
| time interval to previous perihelion [Myr] | 3.66 – 3.7 – 3.74 | |
| percentage of VCs with qprev < 10 | 100 | |