C/2012 K1 PANSTARRS
more info
Comet C/2012 K1 was discovered on 19 May 2012 with Pan-STARRS 1 telescope (Haleakala), that is more than 2 years before its perihelion passage. Later a few pre-discovery images were found taken on 14 May ( MASTER-II Observatory, Tunka) and 17 May (Pan-STARRS 1). It was almost systematically observed until 7 August 2016 (see picture).
C/2012 K1 had its closest approach to the Earth on 31 October 2014 (0.953 au), about 2 months after its perihelion passage.
Preferred solution given here is based on data spanning over 4.23 yr in a range of heliocentric distances: 8.83 au – 1.055 au (perihelion) – 7.85 au.
This Oort spike comet suffers small planetary perturbations during its passage through the planetary system that cause a bit tighter future orbit (see future barycentric orbits).
See also Królikowska 2020.
| solution description | ||
|---|---|---|
| number of observations | 2477 | |
| data interval | 2012 05 14 – 2014 02 13 | |
| data arc selection | data generally limited to pre-perihelion (PRE) | |
| range of heliocentric distances | 8.83 au – 3au | |
| detectability of NG effects in the comet's motion | comet with NG effects strongly manifested in positional data fitting | |
| type of model of motion | GR - gravitational orbit | |
| data weighting | YES | |
| number of residuals | 4919 | |
| RMS [arcseconds] | 0.34 | |
| orbit quality class | 1a | |
| orbital elements (barycentric ecliptic J2000) | ||
|---|---|---|
| Epoch | 1716 01 26 | |
| perihelion date | 2014 08 27.44426891 | ± 0.00034607 |
| perihelion distance [au] | 1.05117105 | ± 0.00000083 |
| eccentricity | 0.99997263 | ± 0.00000071 |
| argument of perihelion [°] | 203.146538 | ± 0.000045 |
| ascending node [°] | 317.658384 | ± 0.000022 |
| inclination [°] | 142.417006 | ± 0.000004 |
| reciprocal semi-major axis [10-6 au-1] | 26.03 | ± 0.67 |
| file containing 5001 VCs swarm |
|---|
| 2012k1pa.bmi |
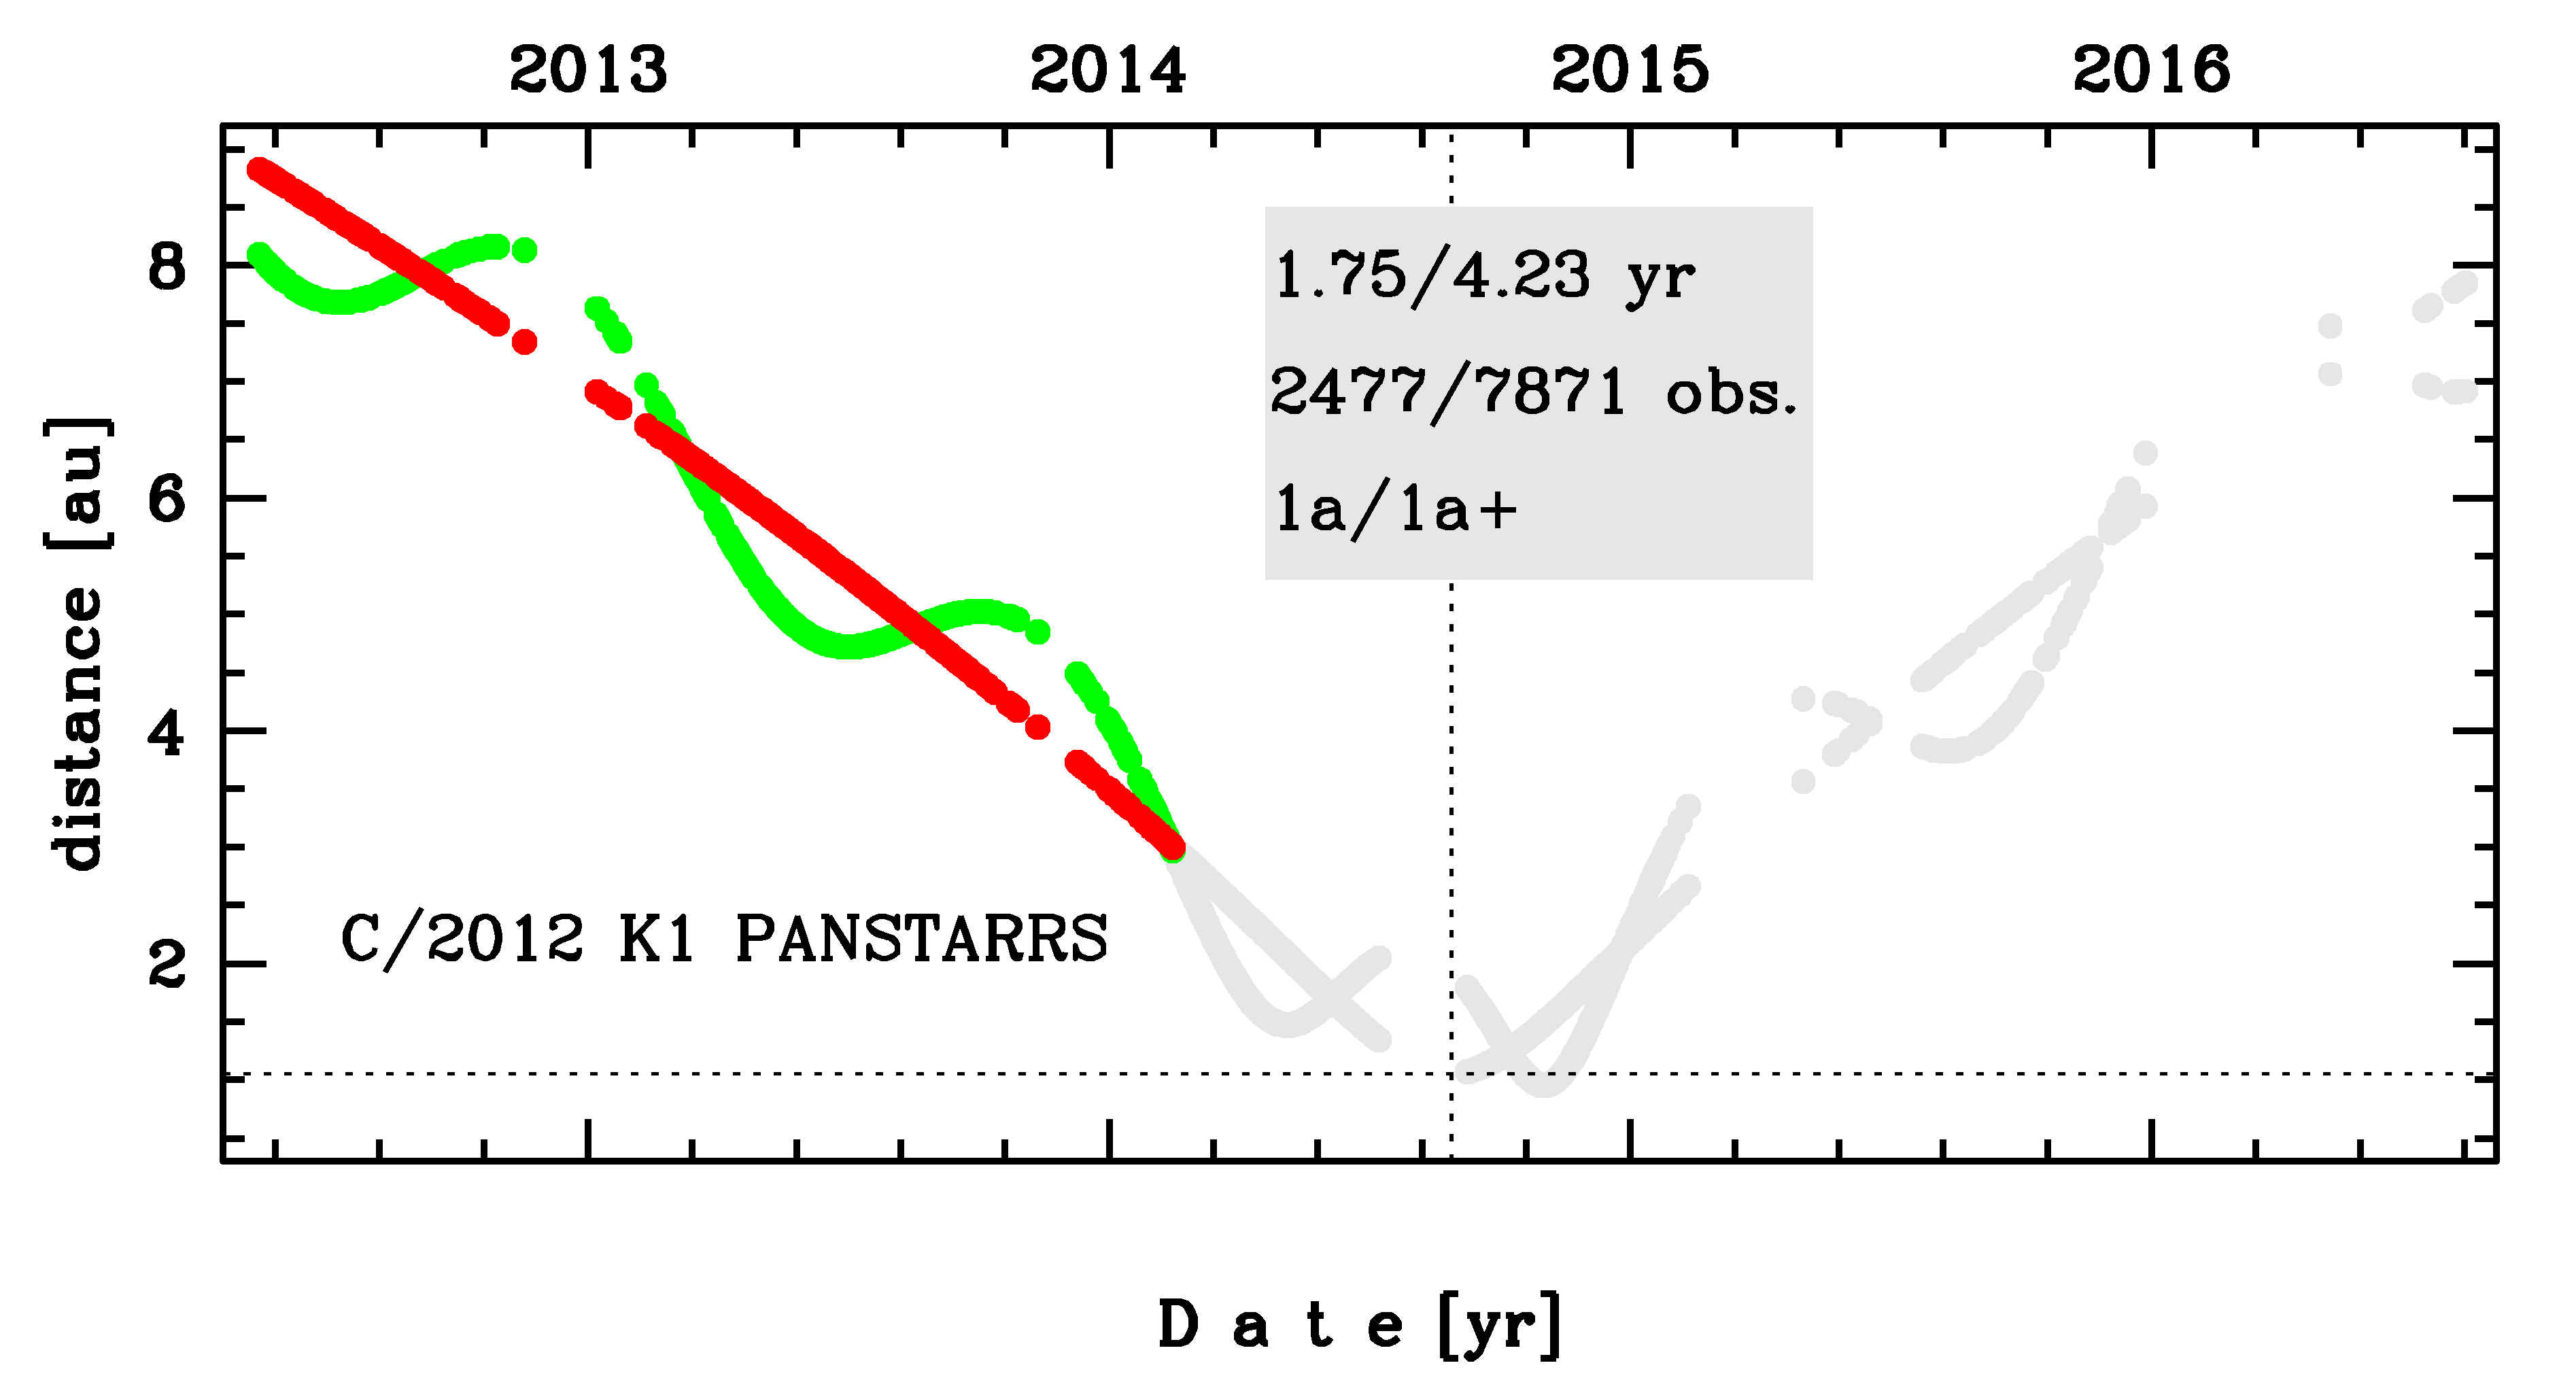
Time distribution of positional observations with corresponding heliocentric (red curve) and geocentric (green curve) distance at which they were taken. The horizontal dotted line shows the perihelion distance for a given comet whereas vertical dotted line — the moment of perihelion passage.
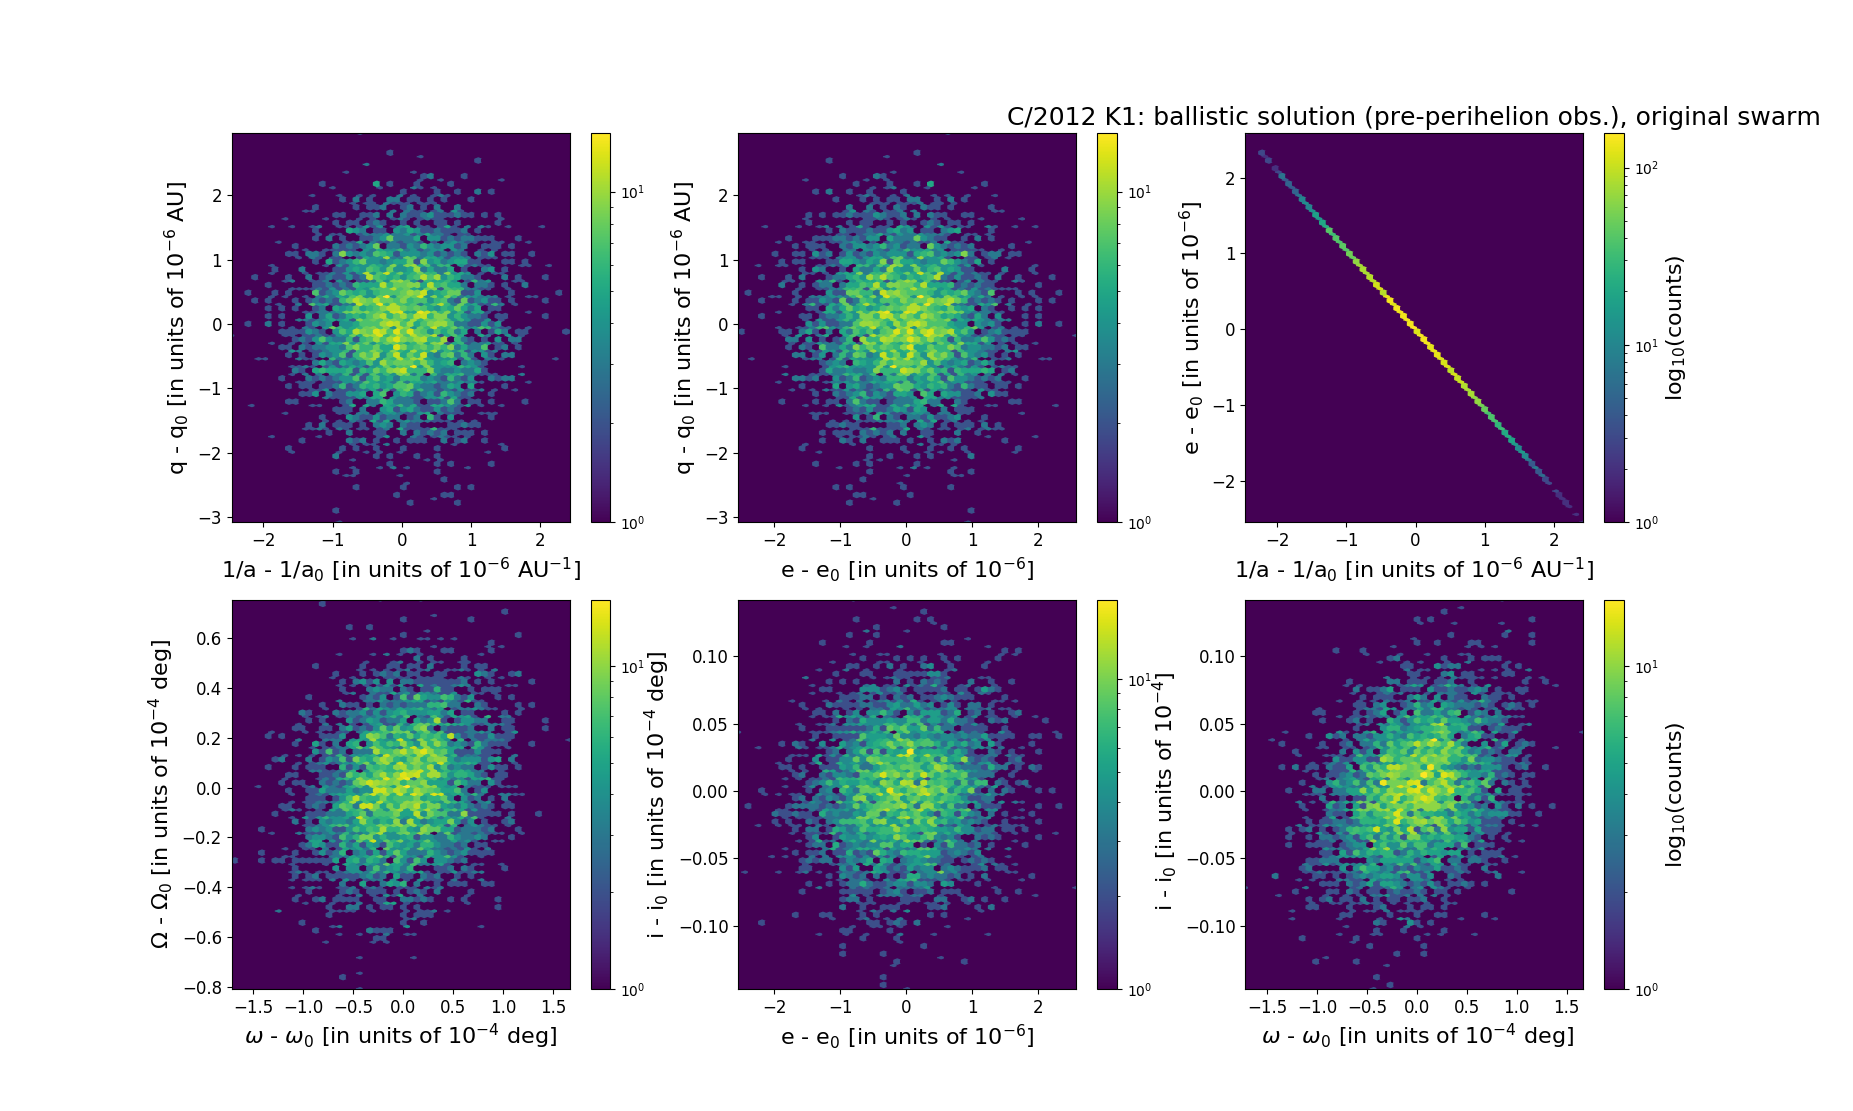
Six 2D-projections of the 6D space of original swarm including 5001 VCs. Each density map is given in logarithmic scale presented on the right in the individual panel.