C/2012 S1 ISON
more info
Comet ISON was discovered on 21 September 2012 with International Scientific Optical Network (ISON) near Kislovodsk, Russia, that is a year and about two months before its perihelion passage. C/2012 S1 was a comet with an extremely small perihelion distance of 0.0125 au (about 3 solar radii). It was intensely followed by numerous observers until its decay. Sekanina and Kracht (2014)
studied the disintegration process of this object in detail, suggesting that the comet fully disintegrated hours before perihelion passage. The first minor outburst occurred 16 days before perihelion (beginning of November) at a distance of 0.7 au from the Sun. However, an unforeseeable fading of the originally very active comet was reported by observers many weeks before this event.
Therefore, two orbits worth noting here are based on data taken at large heliocentric distances (more than 3.4 au from the Sun, solutions: pa, pc) and before the two-month gap starting from 9 June 2013 (see picture). The first orbit is purely GR and gives original 1/a as nearly zero, whereas the second one is an NG orbit obtained using the g(r)-like formula describing CO sublimation. Here this last orbit was taken as preffered orbit.
Comet would have its closest approach to the Earth on 26 December 2003 (0.431 au), about a month after its perihelion passage.
See also Sekanina 2019 and Królikowska 2020.
| solution description | ||
|---|---|---|
| number of observations | 6723 | |
| data interval | 2011 09 30 – 2013 11 22 | |
| data type | observed only before perihelion (PRE) | |
| data arc selection | entire data set (STD) | |
| range of heliocentric distances | 9.39 au – 1.37au | |
| type of model of motion | NS - non-gravitational orbits for standard g(r) | |
| data weighting | YES | |
| number of residuals | 12296 | |
| RMS [arcseconds] | 0.43 | |
| orbit quality class | 1a+ | |
| previous orbit statistics, both Galactic and stellar perturbations were taken into account | ||
|---|---|---|
| no. of returning VCs in the swarm | 0 | |
| no. of escaping VCs in the swarm | 5001 | |
| no. of hyperbolas among escaping VCs in the swarm | 5001 | * |
| previous reciprocal semi-major axis [10-6 au-1] | -11.25 – -9.98 – -8.69 | |
| previous perihelion distance [au] | 3700 – 3770 – 3840 | |
| synchronous stop epoch [Myr] | -2.66 | S |
| percentage of VCs with qprev > 20 | 100 | |
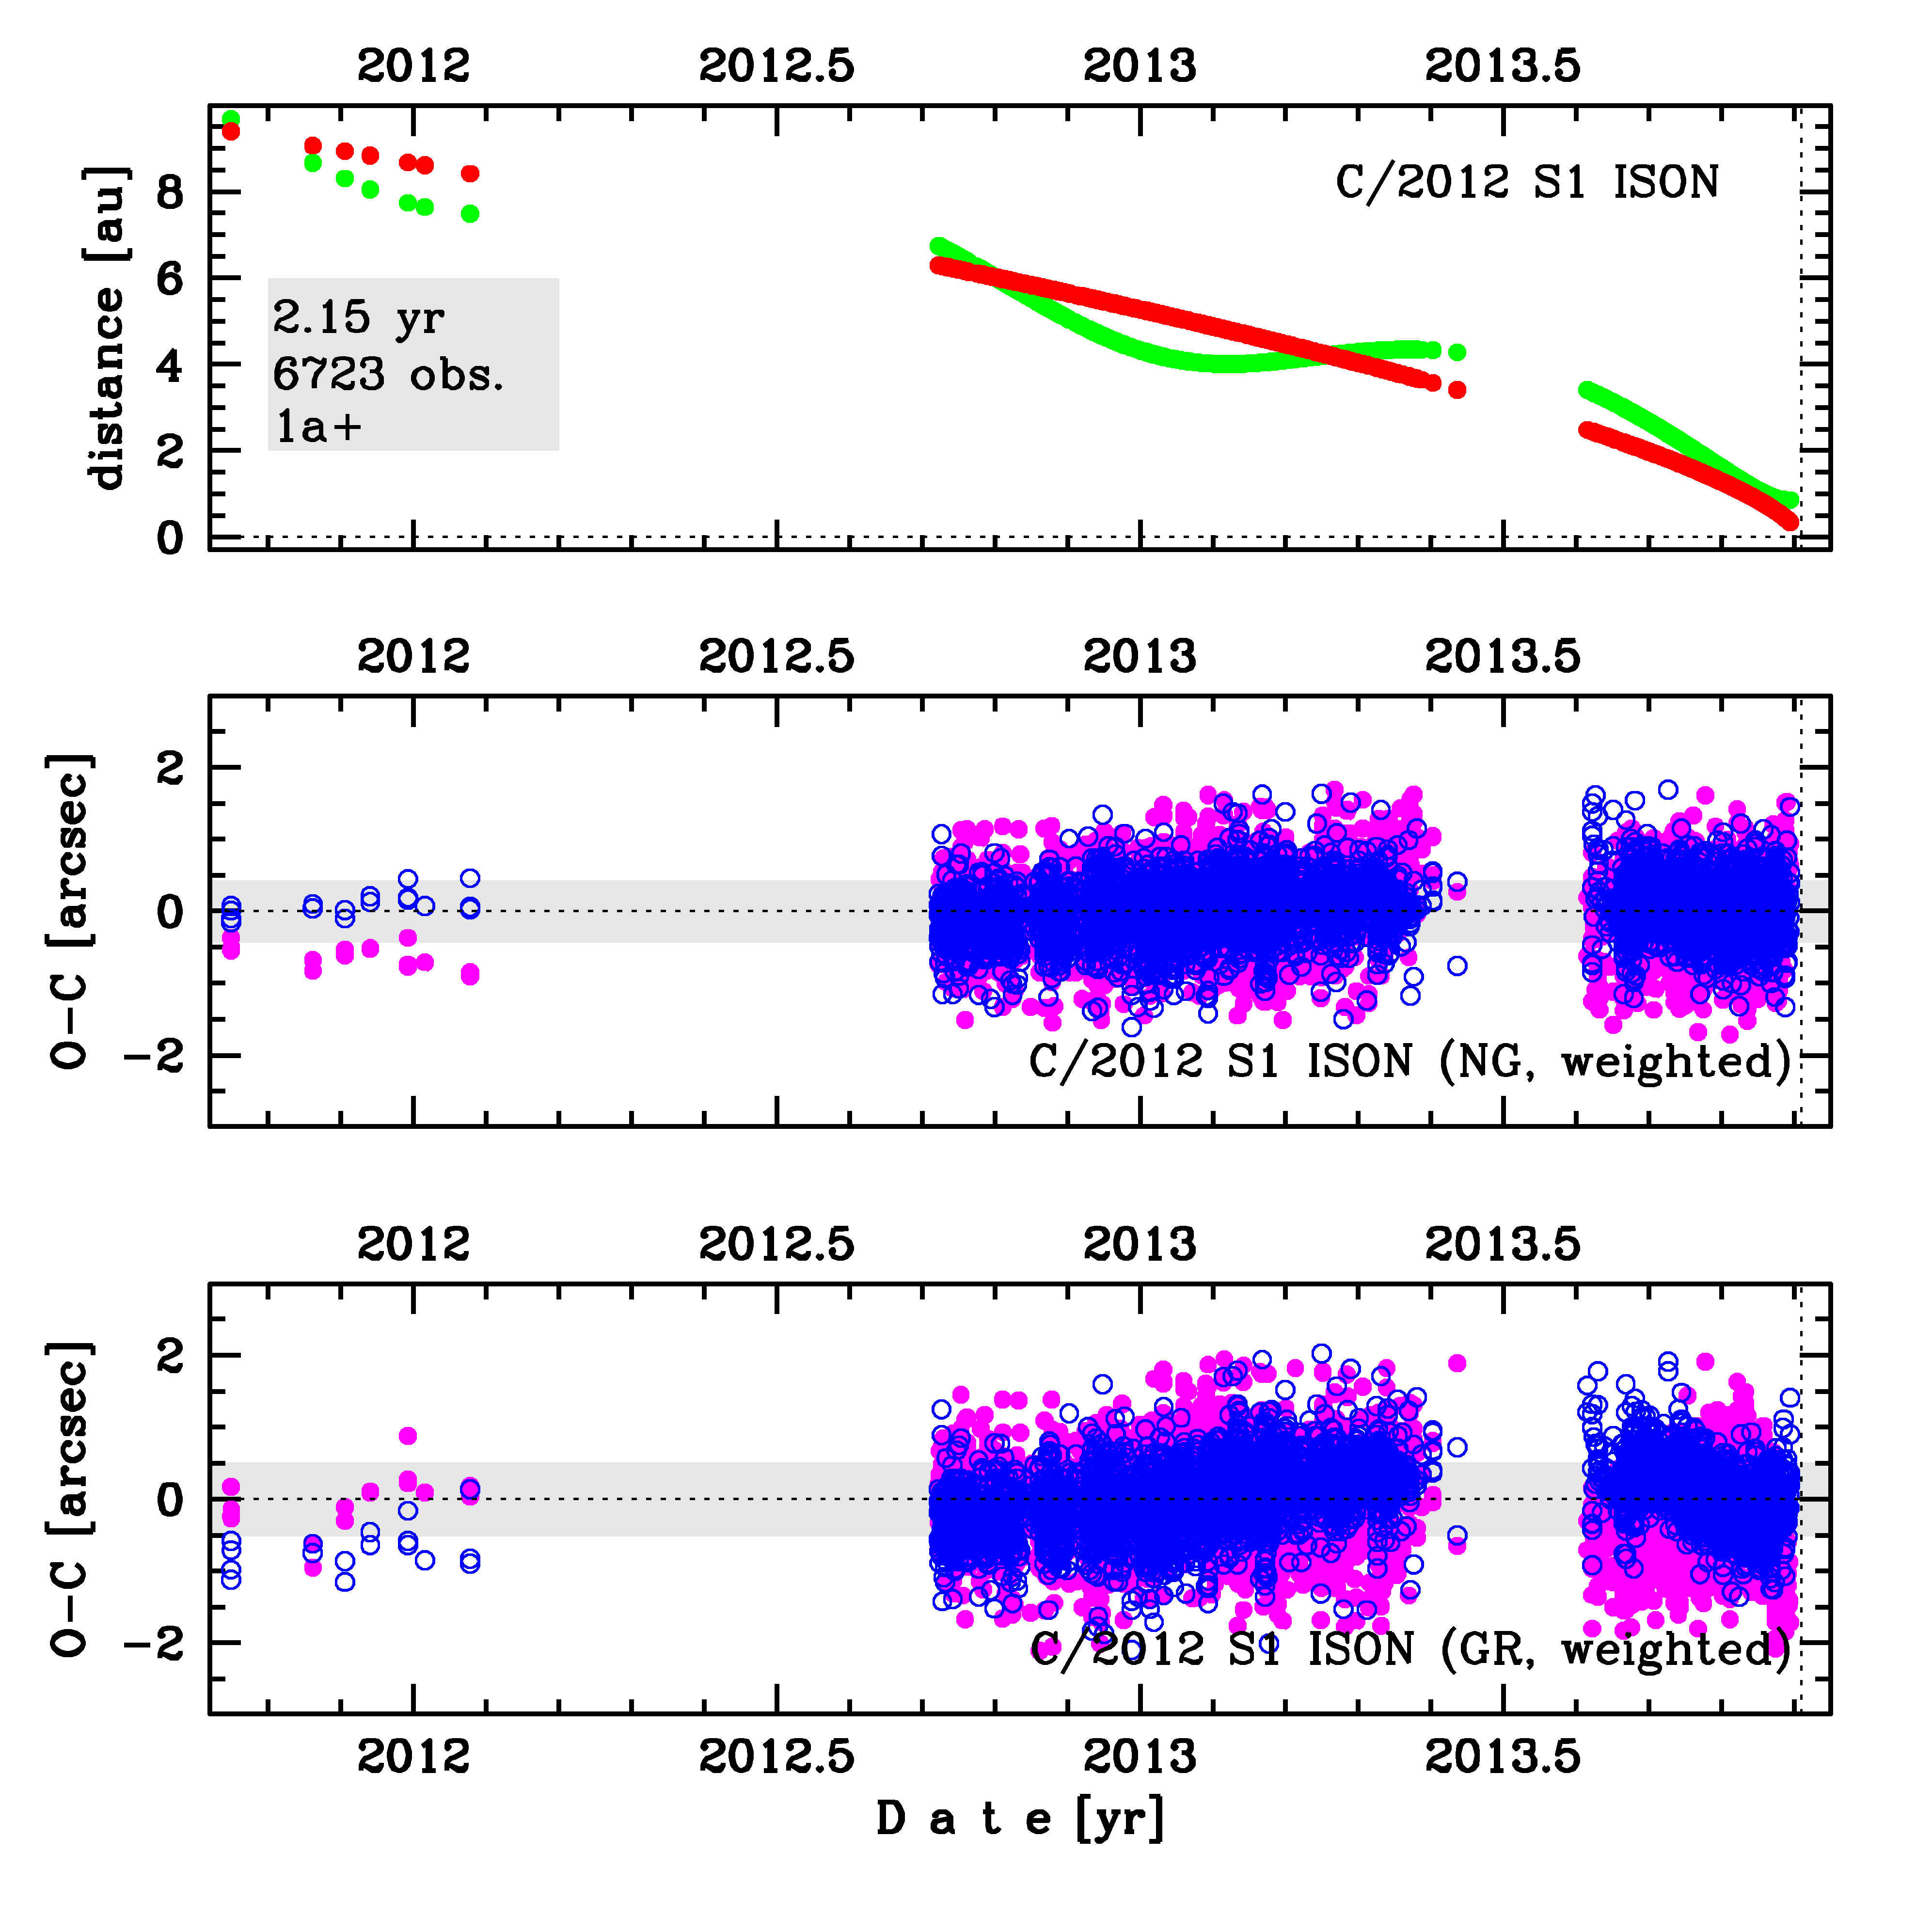
Upper panel: Time distribution of positional observations with corresponding heliocentric (red curve) and geocentric (green curve) distance at which they were taken. The horizontal dotted line shows the perihelion distance for a given comet whereas vertical dotted line — the moment of perihelion passage.
Lower panel (panels): O-C diagram for this(two) solution (solutions) given in this database, where residuals in right ascension are shown using magenta dots and in declination by blue open circles.
Lower panel (panels): O-C diagram for this(two) solution (solutions) given in this database, where residuals in right ascension are shown using magenta dots and in declination by blue open circles.
| previous_g orbit statistics, here only the Galactic tide has been included | ||
|---|---|---|
| no. of returning VCs in the swarm | 0 | |
| no. of escaping VCs in the swarm | 5001 | |
| no. of hyperbolas among escaping VCs in the swarm | 5001 | * |
| previous reciprocal semi-major axis [10-6 au-1] | -9.31 – -8.07 – -6.80 | |
| previous perihelion distance [au] | 16.5 – 17.1 – 17.8 | |
| synchronous stop epoch [Myr] | -2.69 | S |
| percentage of VCs with 10 < qprev < 20 | 100 | |