C/2012 S1 ISON
more info
Comet ISON was discovered on 21 September 2012 with International Scientific Optical Network (ISON) near Kislovodsk, Russia, that is a year and about two months before its perihelion passage. C/2012 S1 was a comet with an extremely small perihelion distance of 0.0125 au (about 3 solar radii). It was intensely followed by numerous observers until its decay. Sekanina and Kracht (2014)
studied the disintegration process of this object in detail, suggesting that the comet fully disintegrated hours before perihelion passage. The first minor outburst occurred 16 days before perihelion (beginning of November) at a distance of 0.7 au from the Sun. However, an unforeseeable fading of the originally very active comet was reported by observers many weeks before this event.
Therefore, two orbits worth noting here are based on data taken at large heliocentric distances (more than 3.4 au from the Sun, solutions: pa, pc) and before the two-month gap starting from 9 June 2013 (see picture). The first orbit is purely GR and gives original 1/a as nearly zero, whereas the second one is an NG orbit obtained using the g(r)-like formula describing CO sublimation. Here this last orbit was taken as preffered orbit.
Comet would have its closest approach to the Earth on 26 December 2003 (0.431 au), about a month after its perihelion passage.
See also Sekanina 2019 and Królikowska 2020.
| solution description | ||
|---|---|---|
| number of observations | 4056 | |
| data interval | 2011 09 30 – 2013 06 08 | |
| data arc selection | data generally limited to pre-perihelion (PRE) | |
| range of heliocentric distances | 9.39 au – 3.41au | |
| type of model of motion | NC - non-gravitational orbits for symmetric CO-g(r)-like function | |
| data weighting | YES | |
| number of residuals | 8059 | |
| RMS [arcseconds] | 0.35 | |
| orbit quality class | 1b | |
| orbital elements (barycentric ecliptic J2000) | ||
|---|---|---|
| Epoch | 1717 04 10 | |
| perihelion date | 2013 11 28.72899334 | ± 1.15383462 |
| perihelion distance [au] | 0.01238150 | ± 0.00000069 |
| eccentricity | 0.99999972 | ± 0.00000017 |
| argument of perihelion [°] | 345.525311 | ± 0.000323 |
| ascending node [°] | 295.768066 | ± 0.000485 |
| inclination [°] | 61.809065 | ± 0.002448 |
| reciprocal semi-major axis [10-6 au-1] | 22.39 | ± 12.63 |
| file containing 5001 VCs swarm |
|---|
| 2012s1pc.bmi |
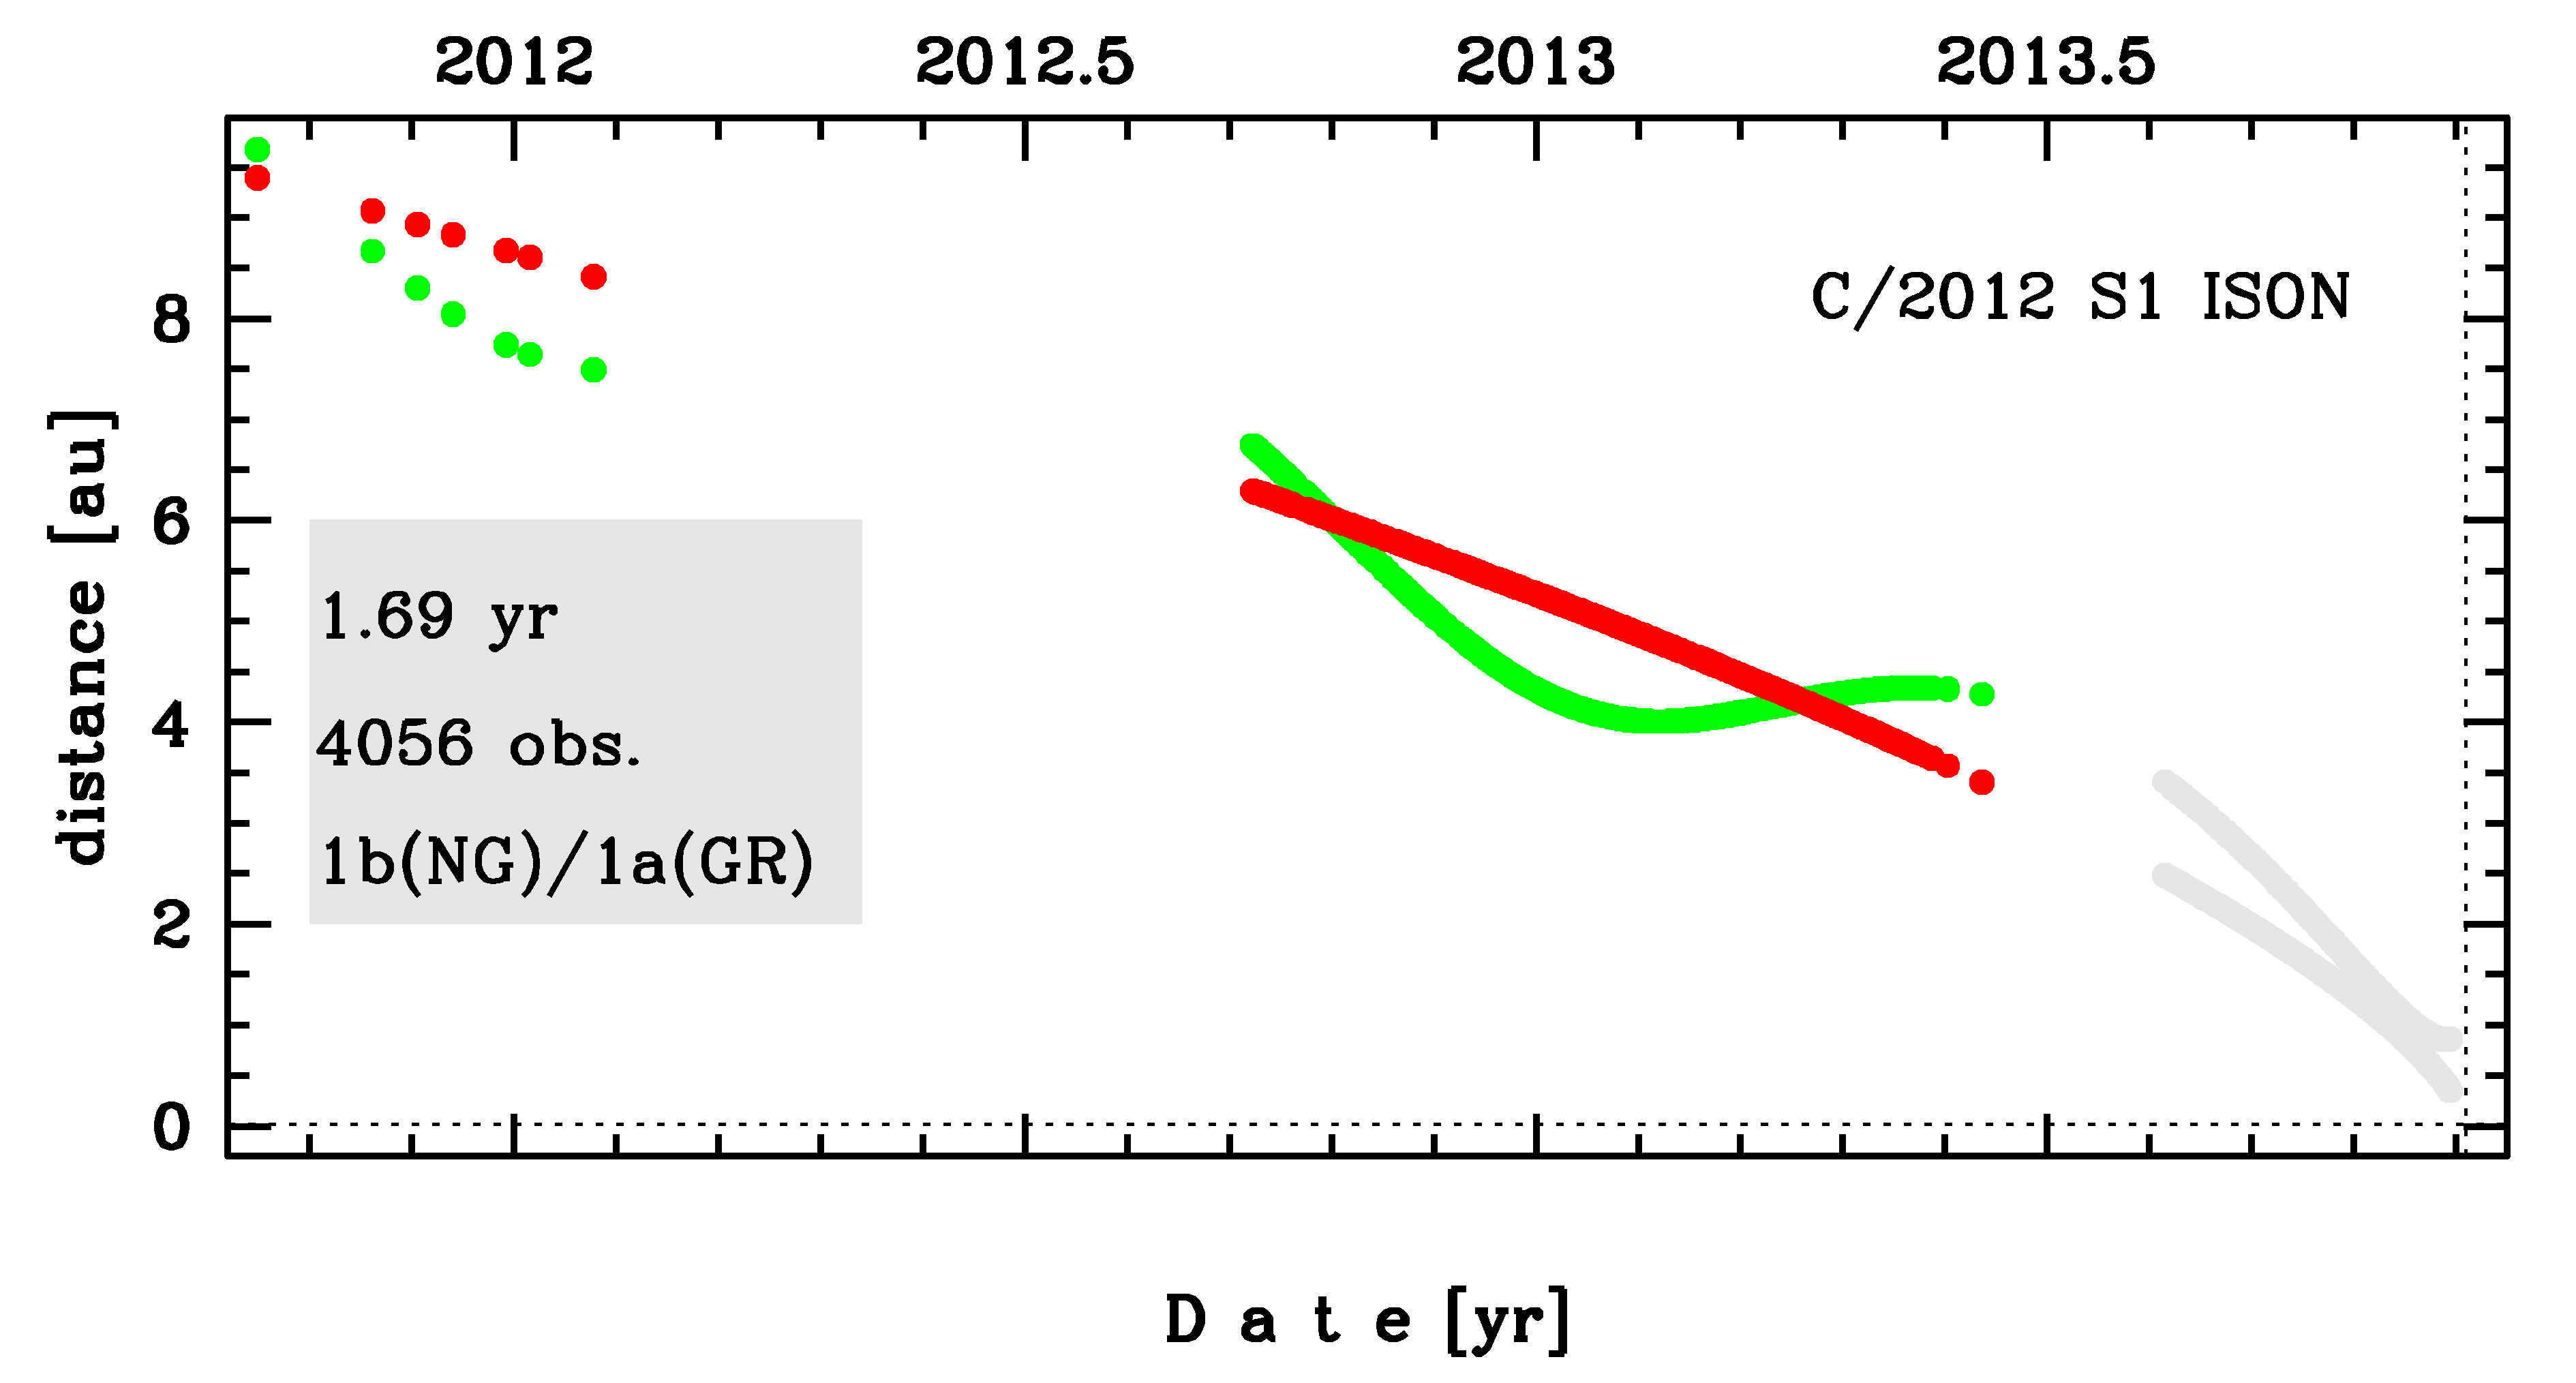
Time distribution of positional observations with corresponding heliocentric (red curve) and geocentric (green curve) distance at which they were taken. The horizontal dotted line shows the perihelion distance for a given comet whereas vertical dotted line — the moment of perihelion passage.
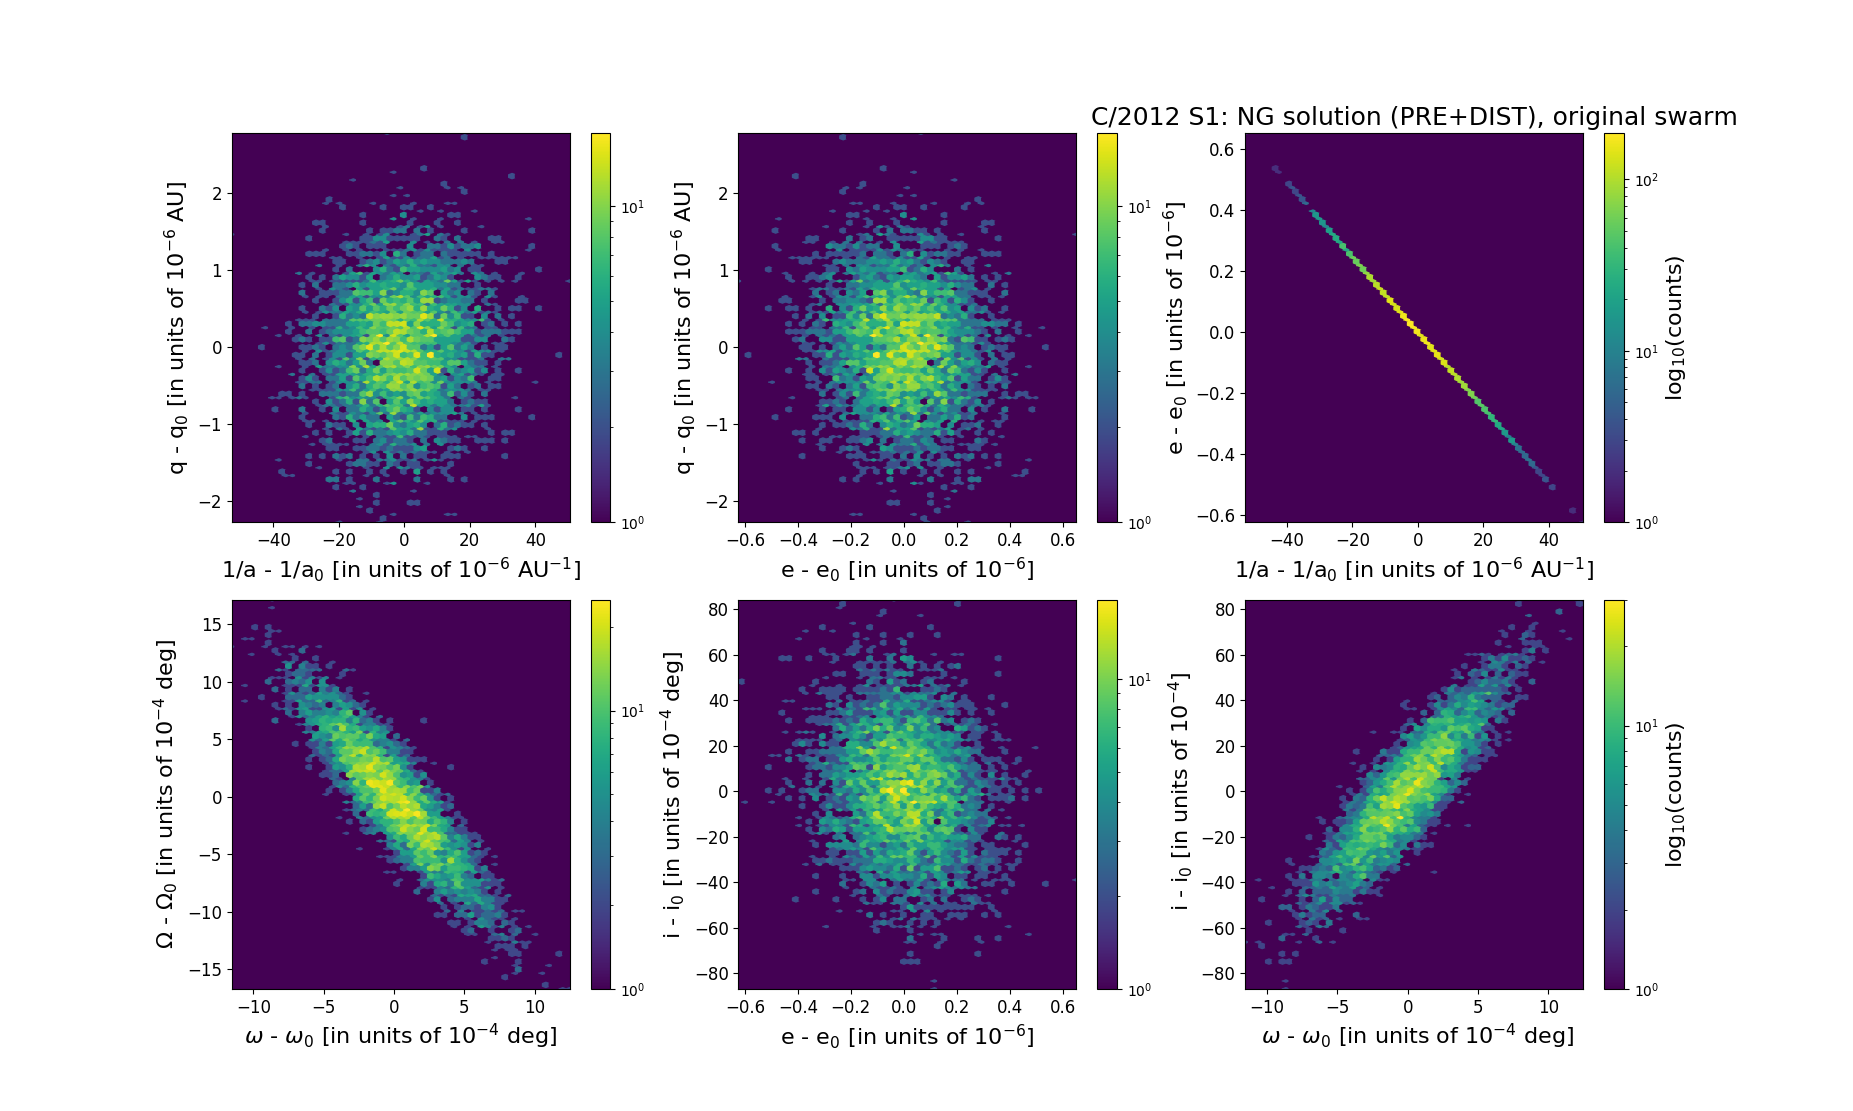
Six 2D-projections of the 6D space of original swarm including 5001 VCs. Each density map is given in logarithmic scale presented on the right in the individual panel.