C/2013 V1 Boattini
more info
Comet C/2013 V1 was discovered on 4 November 2013 by Andrea Boattini during Catalina Sky Survey, that is almost half a year before its perihelion passage, and was followed until 19 January 2015. C/2013 V1 had close approaches to the Earth on 23 December 2013 (1.47 au, about 1.5 month after the discovery).
This is a comet with NG effects strongly manifested in positional data fitting. Solutions 'a5' and 'n5' (preferred) are based on data spanning over 1.2 yr in a range of heliocentric distances: 2.70 au – 1.661 au (perihelion) – 3.69 au. GR solution 'ba' differ from 'a5' in the method of data weighting, silimarly the pair of NG solutions 'bn' and 'n5'.
This Oort spike comet suffers moderate planetary perturbations while passing through the planetary system; these perturbations lead to escape the comet from the planetary zone on a hyperbolic orbit (see future barycentric orbits) for all orbits given here.
| solution description | ||
|---|---|---|
| number of observations | 1806 | |
| data interval | 2013 11 04 – 2014 04 18 | |
| data arc selection | data generally limited to pre-perihelion (PRE) | |
| range of heliocentric distances | 2.7 au – 1.66au | |
| detectability of NG effects in the comet's motion | comet with NG effects strongly manifested in positional data fitting | |
| type of model of motion | GR - gravitational orbit | |
| data weighting | YES | |
| number of residuals | 3582 | |
| RMS [arcseconds] | 0.41 | |
| orbit quality class | 1b | |
| orbital elements (barycentric ecliptic J2000) | ||
|---|---|---|
| Epoch | 1714 06 05 | |
| perihelion date | 2014 04 20.45795416 | ± 0.00006006 |
| perihelion distance [au] | 1.65531398 | ± 0.00000123 |
| eccentricity | 0.99992313 | ± 0.00000159 |
| argument of perihelion [°] | 48.199204 | ± 0.000062 |
| ascending node [°] | 72.769842 | ± 0.000011 |
| inclination [°] | 65.341766 | ± 0.000027 |
| reciprocal semi-major axis [10-6 au-1] | 46.44 | ± 0.96 |
| file containing 5001 VCs swarm |
|---|
| 2013v1p5.bmi |

Upper panel: Time distribution of positional observations with corresponding heliocentric (red curve) and geocentric (green curve) distance at which they were taken. The horizontal dotted line shows the perihelion distance for a given comet whereas vertical dotted line — the moment of perihelion passage.
Middle panel(s): O-C diagram for a given solution (sometimes in comparison to another solution available in CODE), where residuals in right ascension are shown using magenta dots and in declination by blue open circles.
Lowest panel: Relative weights for a given data set(s).
Middle panel(s): O-C diagram for a given solution (sometimes in comparison to another solution available in CODE), where residuals in right ascension are shown using magenta dots and in declination by blue open circles.
Lowest panel: Relative weights for a given data set(s).
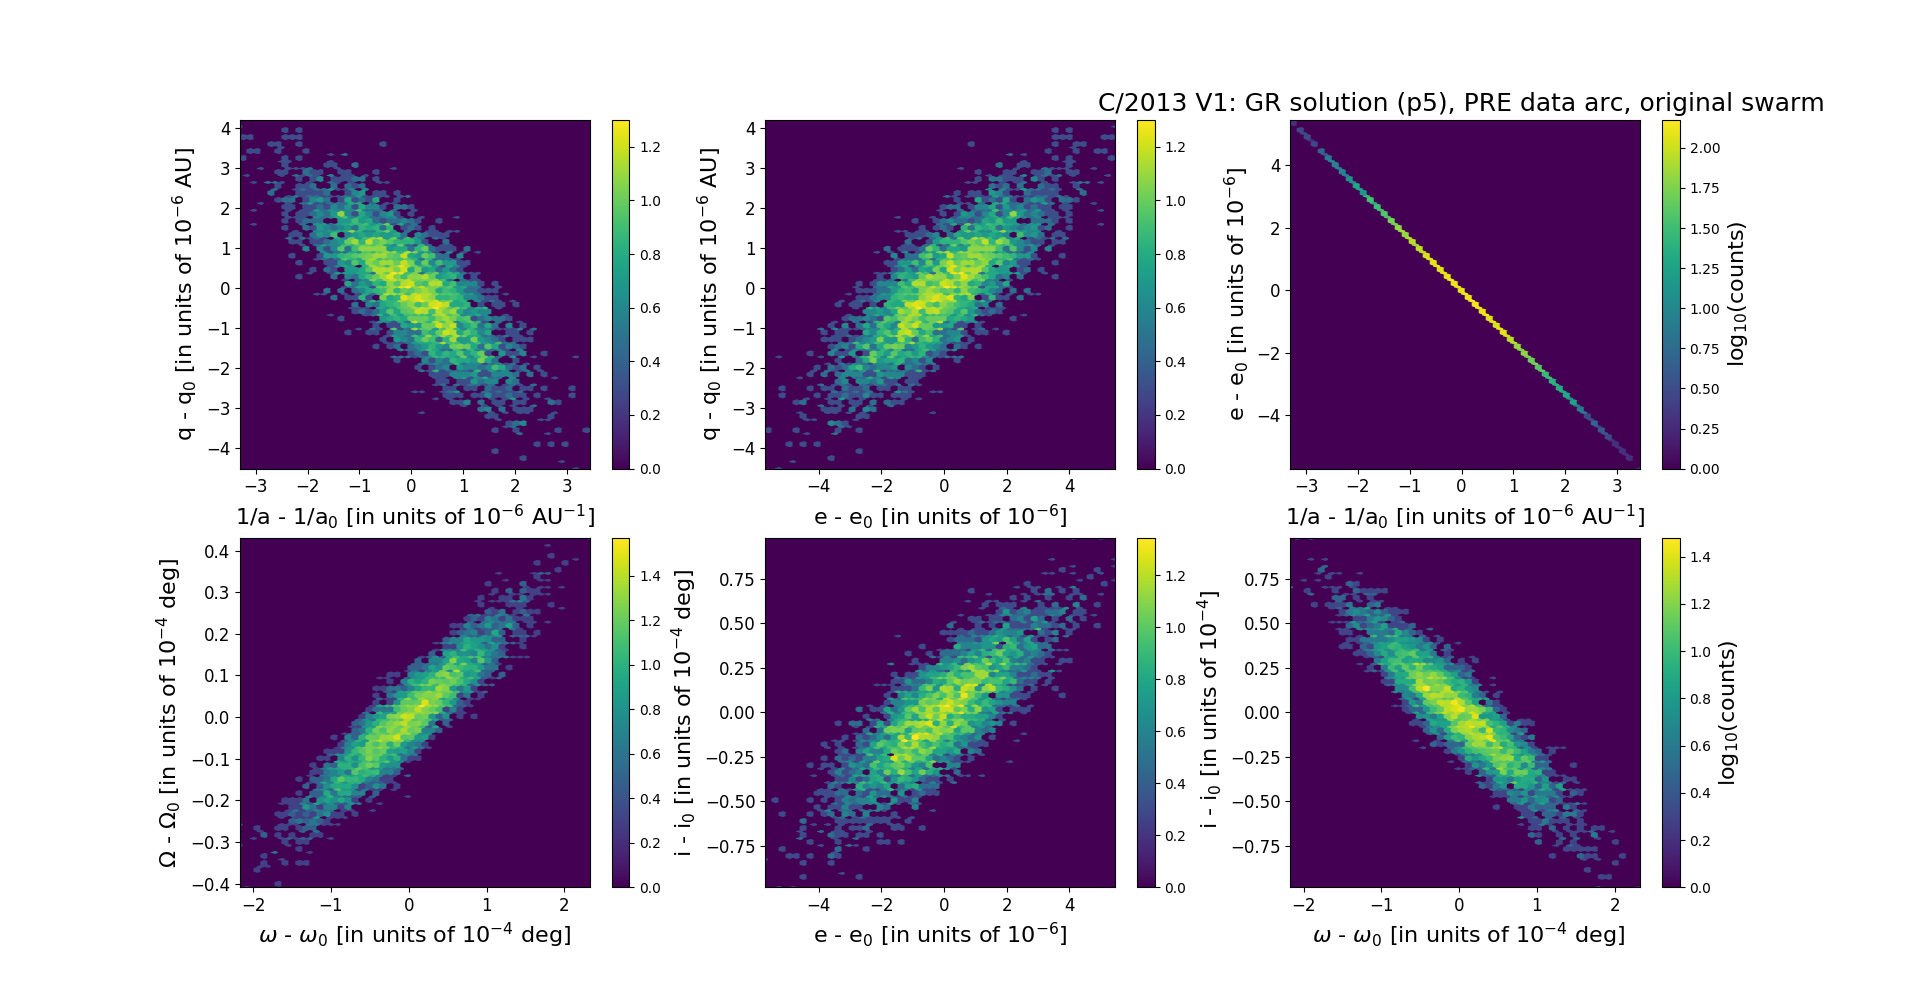
Six 2D-projections of the 6D space of original swarm including 5001 VCs. Each density map is given in logarithmic scale presented on the right in the individual panel.