C/2013 X1 PanSTARRS
more info
Comet C/2013 X1 was discovered on 4 December 2013 at the Pan-STARRS 1 observatory on Mount Haleakala in Hawaii, that is about a year and five months before its perihelion passage, and was followed until 29 January 2018. C/2013 X1 had closest approach to the Earth on 21 June 2016 (0.640 au, almost two months after the perihelion passage).
This is the comet with NG effects strongly manifested in positional data fitting. Solutions 'a5' (GR), 'n5' (NG), and t4 (asymm. NG, preferred orbit) are based on data spanning over 4.3 yr in a range of heliocentric distances: 9.25 au – 1.314 au (perihelion) – 7.17 au. Also NG orbit based on distant part of pre-perihelion leg of orbit was possible to obtain (see solution 'pd').
All solutions result in original orbit outside Oort spike with semimajor axis of about 2600–6100 au. This comet suffers moderate planetary perturbations while passing through the planetary system; these perturbations lead to escape the comet from the planetary zone on a hyperbolic orbit (see future barycentric orbits for all orbits given here).
| solution description | ||
|---|---|---|
| number of observations | 3324 | |
| data interval | 2013 10 17 – 2018 01 29 | |
| data type | perihelion within the observation arc (FULL) | |
| data arc selection | entire data set (STD) | |
| range of heliocentric distances | 9.25 au – 1.31 au (perihelion) – 7.17 au | |
| detectability of NG effects in the comet's motion | comet with NG effects strongly manifested in positional data fitting | |
| type of model of motion | GR - gravitational orbit | |
| data weighting | YES | |
| number of residuals | 6611 | |
| RMS [arcseconds] | 0.65 | |
| orbit quality class | 1a+ | |
| previous orbit statistics, both Galactic and stellar perturbations were taken into account | ||
|---|---|---|
| no. of returning VCs in the swarm | 5001 | * |
| no. of escaping VCs in the swarm | 0 | |
| no. of hyperbolas among escaping VCs in the swarm | 0 | |
| previous reciprocal semi-major axis [10-6 au-1] | 244.91 – 245.43 – 245.96 | |
| previous perihelion distance [au] | 1.31319 – 1.31323 – 1.31328 | |
| previous aphelion distance [103 au] | 8.13 – 8.148 – 8.165 | |
| time interval to previous perihelion [Myr] | 0.2588 – 0.2596 – 0.2605 | |
| percentage of VCs with qprev < 10 | 100 | |
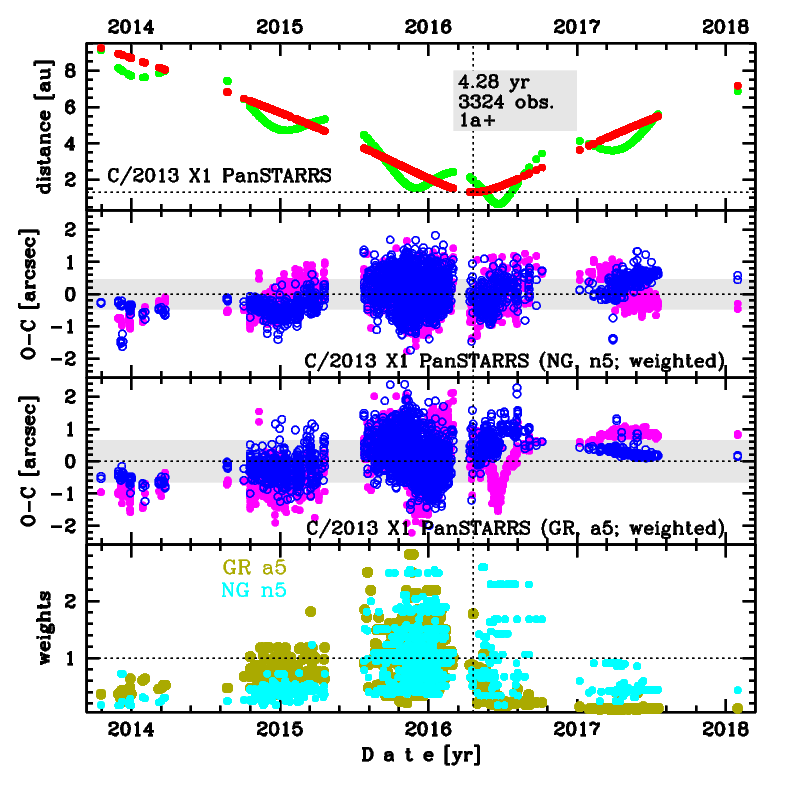
Upper panel: Time distribution of positional observations with corresponding heliocentric (red curve) and geocentric (green curve) distance at which they were taken. The horizontal dotted line shows the perihelion distance for a given comet whereas vertical dotted line — the moment of perihelion passage.
Middle panel(s): O-C diagram for a given solution (sometimes in comparison to another solution available in CODE), where residuals in right ascension are shown using magenta dots and in declination by blue open circles.
Lowest panel: Relative weights for a given data set(s).
Middle panel(s): O-C diagram for a given solution (sometimes in comparison to another solution available in CODE), where residuals in right ascension are shown using magenta dots and in declination by blue open circles.
Lowest panel: Relative weights for a given data set(s).
| previous_g orbit statistics, here only the Galactic tide has been included | ||
|---|---|---|
| no. of returning VCs in the swarm | 5001 | * |
| no. of escaping VCs in the swarm | 0 | |
| no. of hyperbolas among escaping VCs in the swarm | 0 | |
| previous reciprocal semi-major axis [10-6 au-1] | 244.91 – 245.42 – 245.96 | |
| previous perihelion distance [au] | 1.31493 – 1.31497 – 1.31501 | |
| previous aphelion distance [103 au] | 8.13 – 8.148 – 8.165 | |
| time interval to previous perihelion [Myr] | 0.2588 – 0.2596 – 0.2604 | |
| percentage of VCs with qprev < 10 | 100 | |