C/2014 W10 PanSTARRS
more info
Comet C/2014 W10 was discovered on 25 November 2014 with the Pan-STARRS 1 telescope (Haleakala), that is more than one year before its perihelion passage. This comet was observed only 12 days and its orbit was extremaly uncertain until the calculations presented by Królikowska and Dybczyński (2018) Fortunately later, a set of three measurement going about one year back (from 24 November of 2013) was found (gathered using the same telescope).
Thus, the GR solution given here is based on pre-perihelion data span over 1.04 yr in a range of heliocentric distances from 9.14 au to 8.12 au.
Comet had its closest approach to the Earth on 9 November 2015 (6.90 au), more than 3 months before its perihelion passage.
This Oort spike comet suffers small planetary perturbations during its passage through the planetary system; and its future orbit have semimajor axis longer than 10,000 au.
| solution description | ||
|---|---|---|
| number of observations | 28 | |
| data interval | 2013 11 24 – 2014 12 07 | |
| data type | observed only before perihelion (PRE) | |
| data arc selection | entire data set (STD) | |
| range of heliocentric distances | 9.14 au – 8.12au | |
| detectability of NG effects in the comet's motion | NG effects not determinable | |
| type of model of motion | GR - gravitational orbit | |
| data weighting | NO | |
| number of residuals | 56 | |
| RMS [arcseconds] | 0.21 | |
| orbit quality class | 1b | |
| orbital elements (barycentric ecliptic J2000) | ||
|---|---|---|
| Epoch | 1706 04 02 | |
| perihelion date | 2016 02 17.56813519 | ± 0.02603628 |
| perihelion distance [au] | 7.65614117 | ± 0.00012154 |
| eccentricity | 0.99988482 | ± 0.00005141 |
| argument of perihelion [°] | 42.352667 | ± 0.002272 |
| ascending node [°] | 43.225305 | ± 0.000030 |
| inclination [°] | 83.326532 | ± 0.000125 |
| reciprocal semi-major axis [10-6 au-1] | 15.04 | ± 6.71 |
| file containing 5001 VCs swarm |
|---|
| 2014w1b1.bmi |

Time distribution of positional observations with corresponding heliocentric (red curve) and geocentric (green curve) distance at which they were taken. The horizontal dotted line shows the perihelion distance for a given comet whereas vertical dotted line — the moment of perihelion passage.
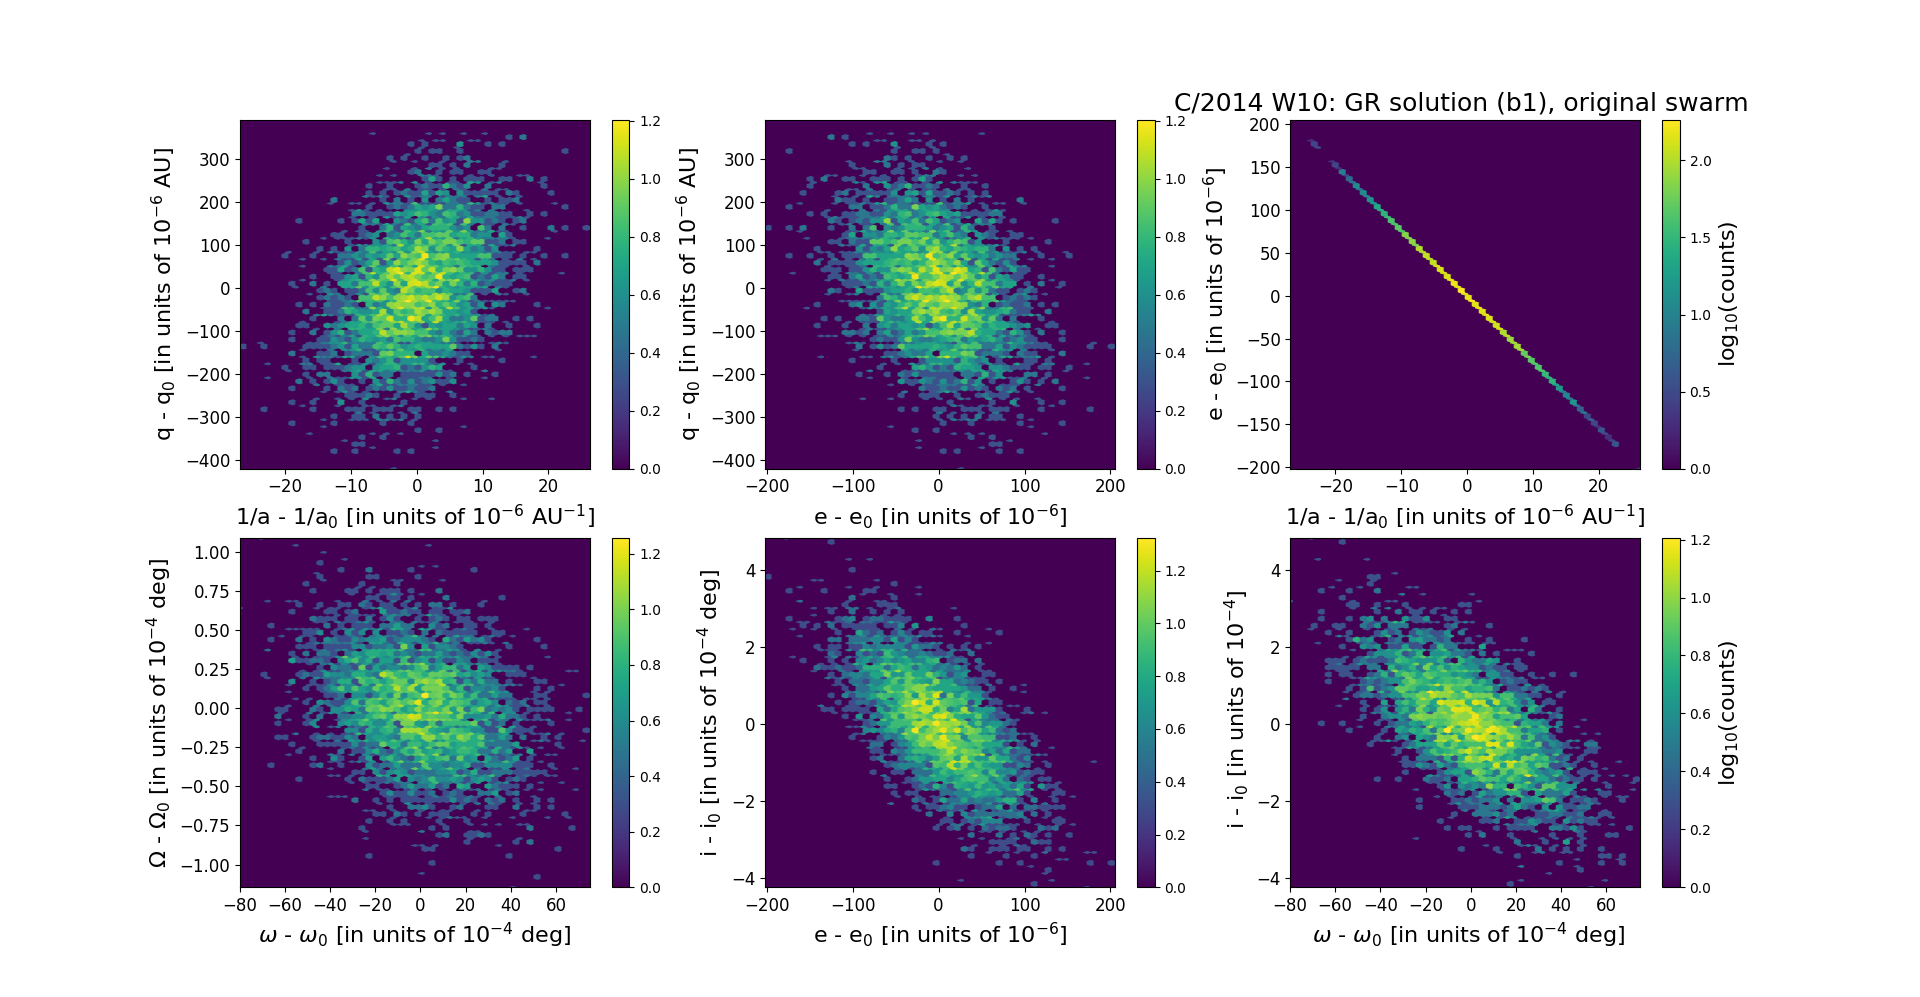
Six 2D-projections of the 6D space of original swarm including 5001 VCs. Each density map is given in logarithmic scale presented on the right in the individual panel.