C/2015 D3 PANSTARRS
more info
Comet C/2015 D3 was discovered on 19 February 2015 with Pan-STARRS 1 telescope (Haleakala), that is about months after its perihelion passage. Some prediscovery images of this comet were found: taken on 17 February 2015 by Space Surveillance Telescope (Atom Site) and 8 April 2013 by Siding Spring Survey. This comet was observed until 21 February 2020.
Comet had its closest approach to the Earth on 28 February 2016 (7.167 au), about 2 months before its perihelion passage.
Solutions given here are based on data spanning over 6.87 yr in a range of heliocentric distances: 10.46 au – 8.149 au (perihelion) – 11.49 au.
This Oort spike comet suffers slight planetary perturbations during its passage through the planetary system; however, these perturbations likely lead to escape the comet from the planetary zone on a hyperbolic orbit (see future barycentric orbits).
See also Królikowska and Dones 2023.
| solution description | ||
|---|---|---|
| number of observations | 282 | |
| data interval | 2013 04 08 – 2018 02 13 | |
| data type | perihelion within the observation arc (FULL) | |
| data arc selection | entire data set (STD) | |
| range of heliocentric distances | 10.46 au – 8.15 au (perihelion) – 9.03 au | |
| detectability of NG effects in the comet's motion | NG effects not determinable | |
| type of model of motion | GR - gravitational orbit | |
| data weighting | YES | |
| number of residuals | 549 | |
| RMS [arcseconds] | 0.33 | |
| orbit quality class | 1a+ | |
| orbital elements (heliocentric ecliptic J2000) | ||
|---|---|---|
| Epoch | 2016 05 12 | |
| perihelion date | 2016 04 30.78880394 | ± 0.00118321 |
| perihelion distance [au] | 8.14877530 | ± 0.00000841 |
| eccentricity | 1.00249983 | ± 0.00000711 |
| argument of perihelion [°] | 2.849893 | ± 0.000066 |
| ascending node [°] | 156.980463 | ± 0.000006 |
| inclination [°] | 128.509312 | ± 0.000013 |
| reciprocal semi-major axis [10-6 au-1] | -306.77 | ± 0.87 |
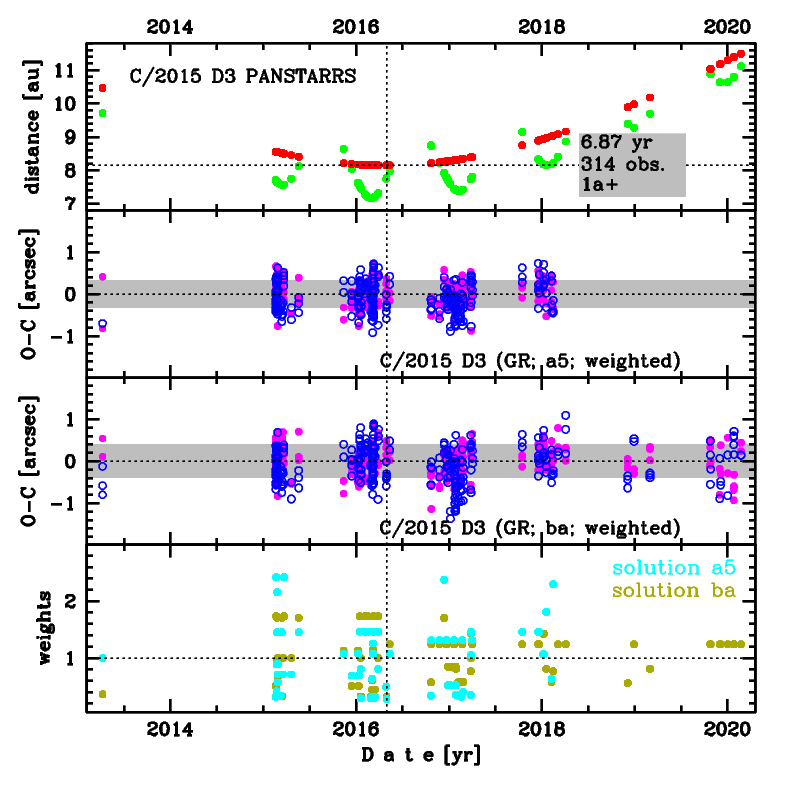
Upper panel: Time distribution of positional observations with corresponding heliocentric (red curve) and geocentric (green curve) distance at which they were taken. The horizontal dotted line shows the perihelion distance for a given comet whereas vertical dotted line — the moment of perihelion passage.
Middle panel(s): O-C diagram for a given solution (sometimes in comparison to another solution available in CODE), where residuals in right ascension are shown using magenta dots and in declination by blue open circles.
Lowest panel: Relative weights for a given data set(s).
Middle panel(s): O-C diagram for a given solution (sometimes in comparison to another solution available in CODE), where residuals in right ascension are shown using magenta dots and in declination by blue open circles.
Lowest panel: Relative weights for a given data set(s).